ETC1010: Data Modelling and Computing
Lecture 7B: Linear Models part II
Dr. Nicholas Tierney & Professor Di Cook
EBS, Monash U.
2019-09-13
Recap
Overview
- Feedback from the tests
- What is r2
- (pull examples from exercise)
- short exercise in class to calculate correlation and r2 and answer questions
- augment?
- understanding residuals
- components of variation?
Feedback from assignment 1 (from Sherry)
- Some students forgot to answer some of the questions: "Is there anything else in the excel spreadsheet we could look at?".
- Some groups need to follow Amelia's three-sentence interpretation to describe plots.
- For the last questions, I (Sherry) expect people to also talks about how the analysis would help with the business.
Presentation & grammar:
- Remember to do a spell check before submitting any of your files
- Don't need install.package in your Rmd library() is enough
Other Admin
Mid-semester exam
- Marks will be released at the end of class
Project deadline (today)
Find team members, and potential topics to study (ed quiz will be posted soon)
What is correlation?
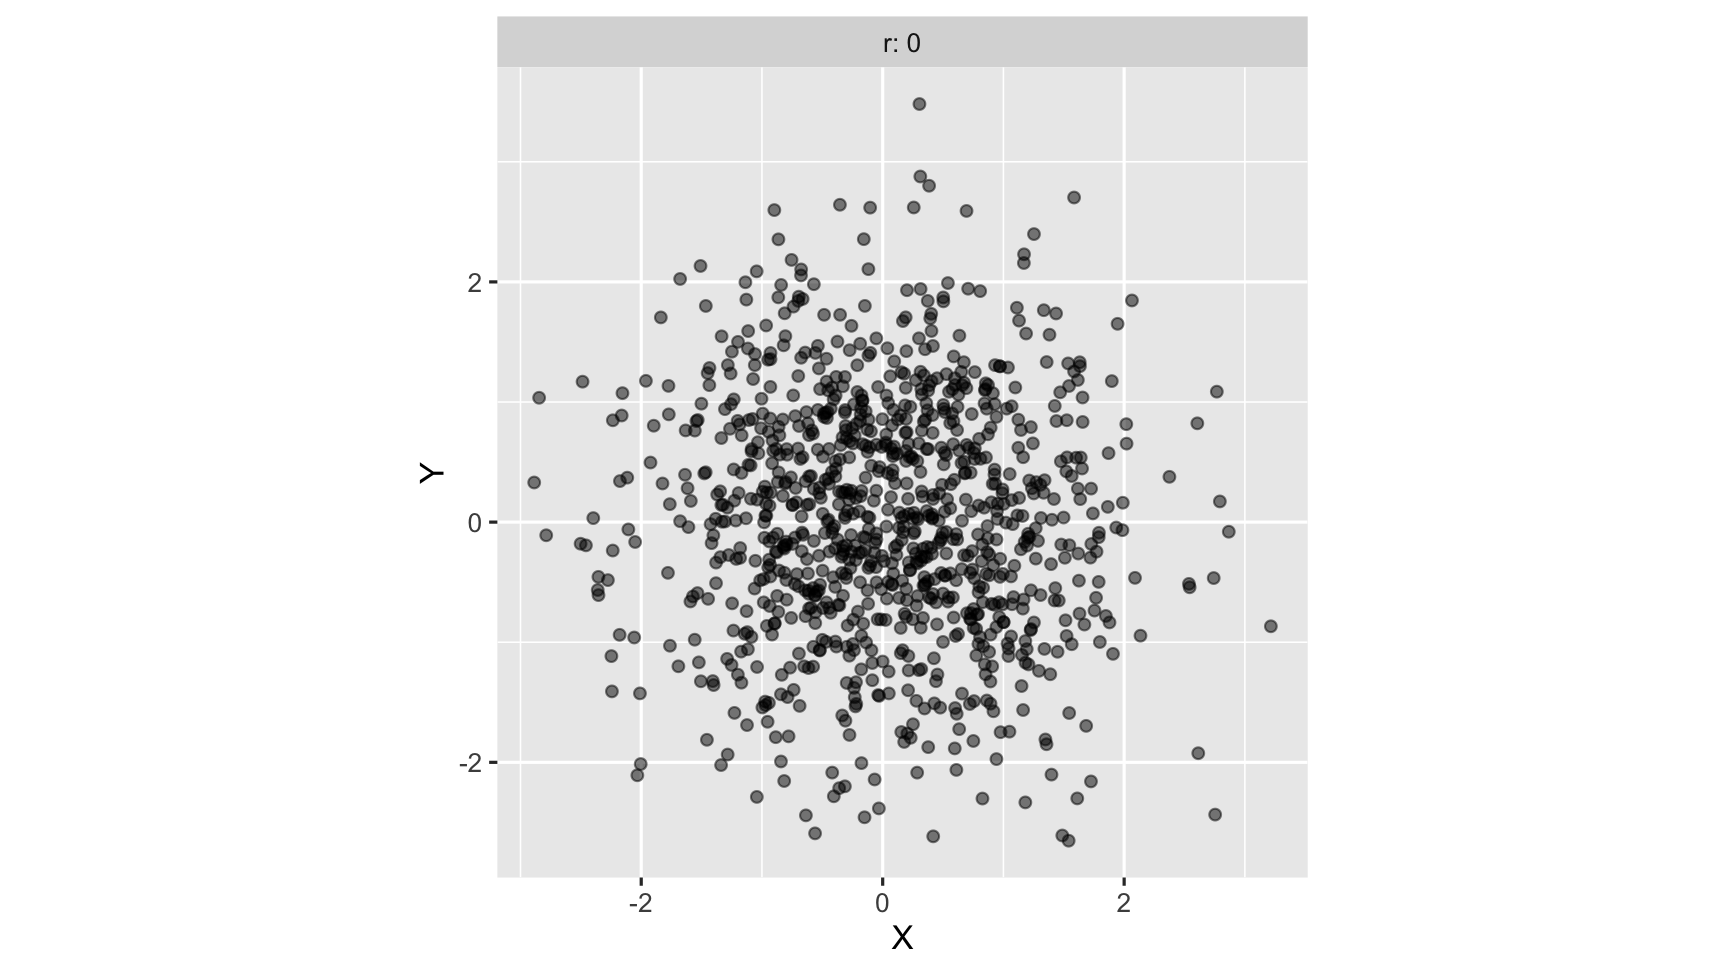
- Linear association between two variables can be described by correlation
- Ranges from -1 to +1
Strongest Positive correlation: As one variable increases, so does another variable
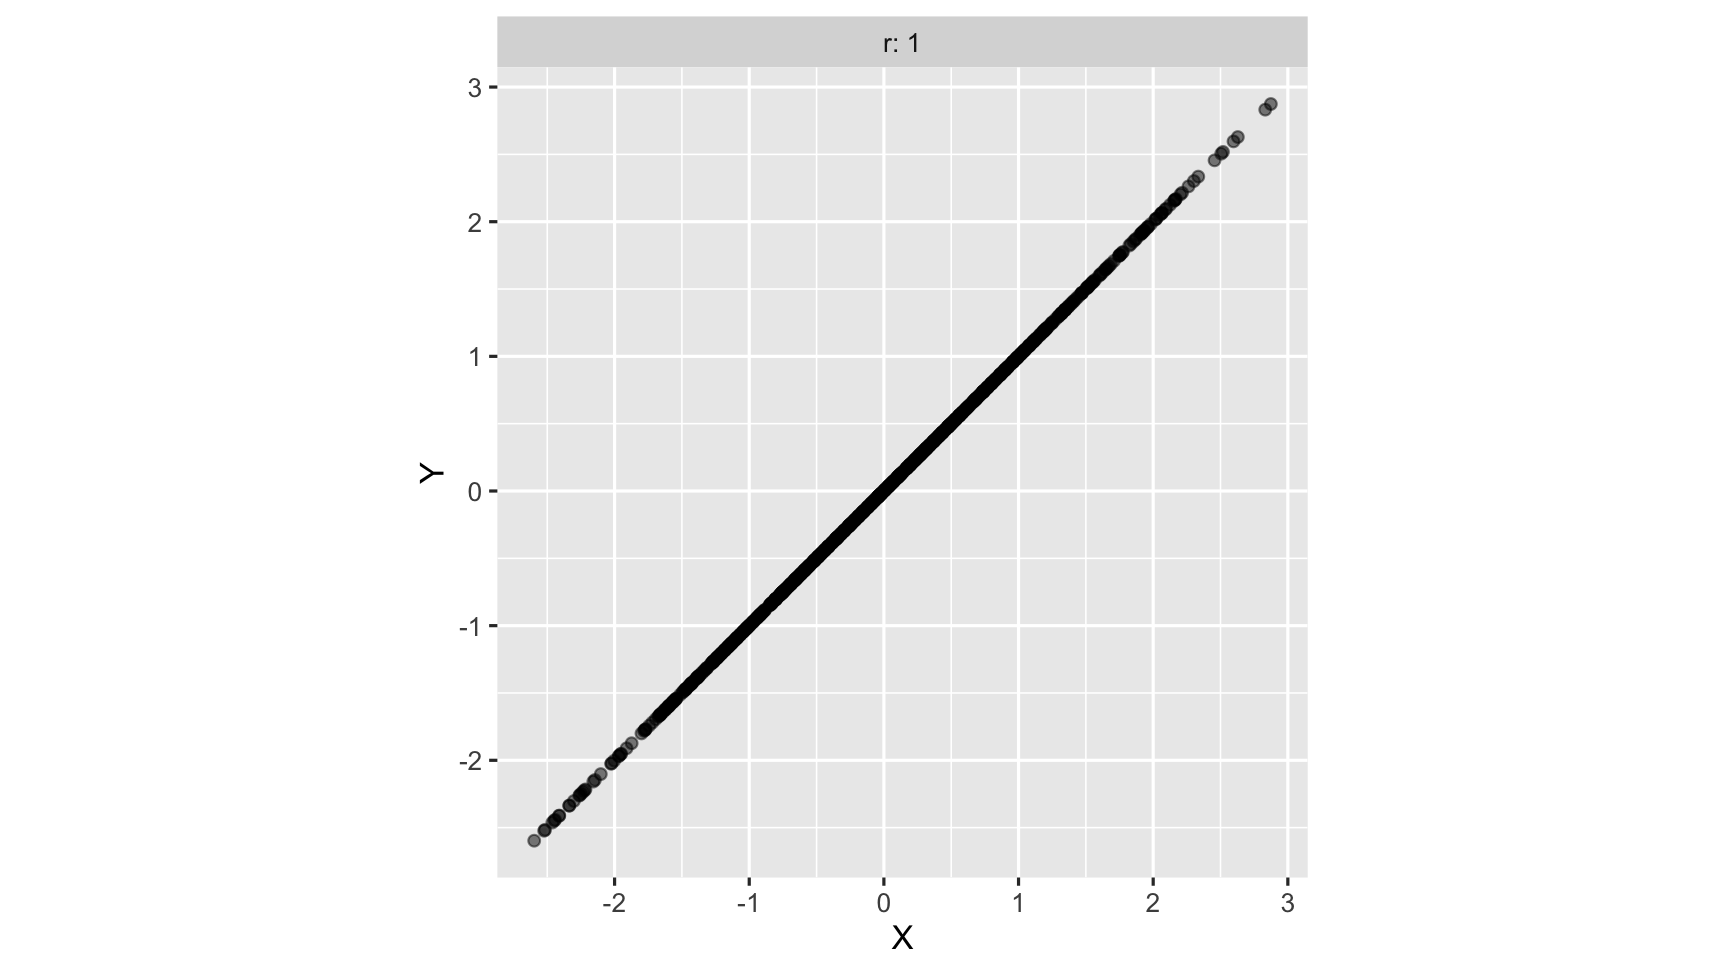
strong Positive correlation: As one variable increases, so does another variable
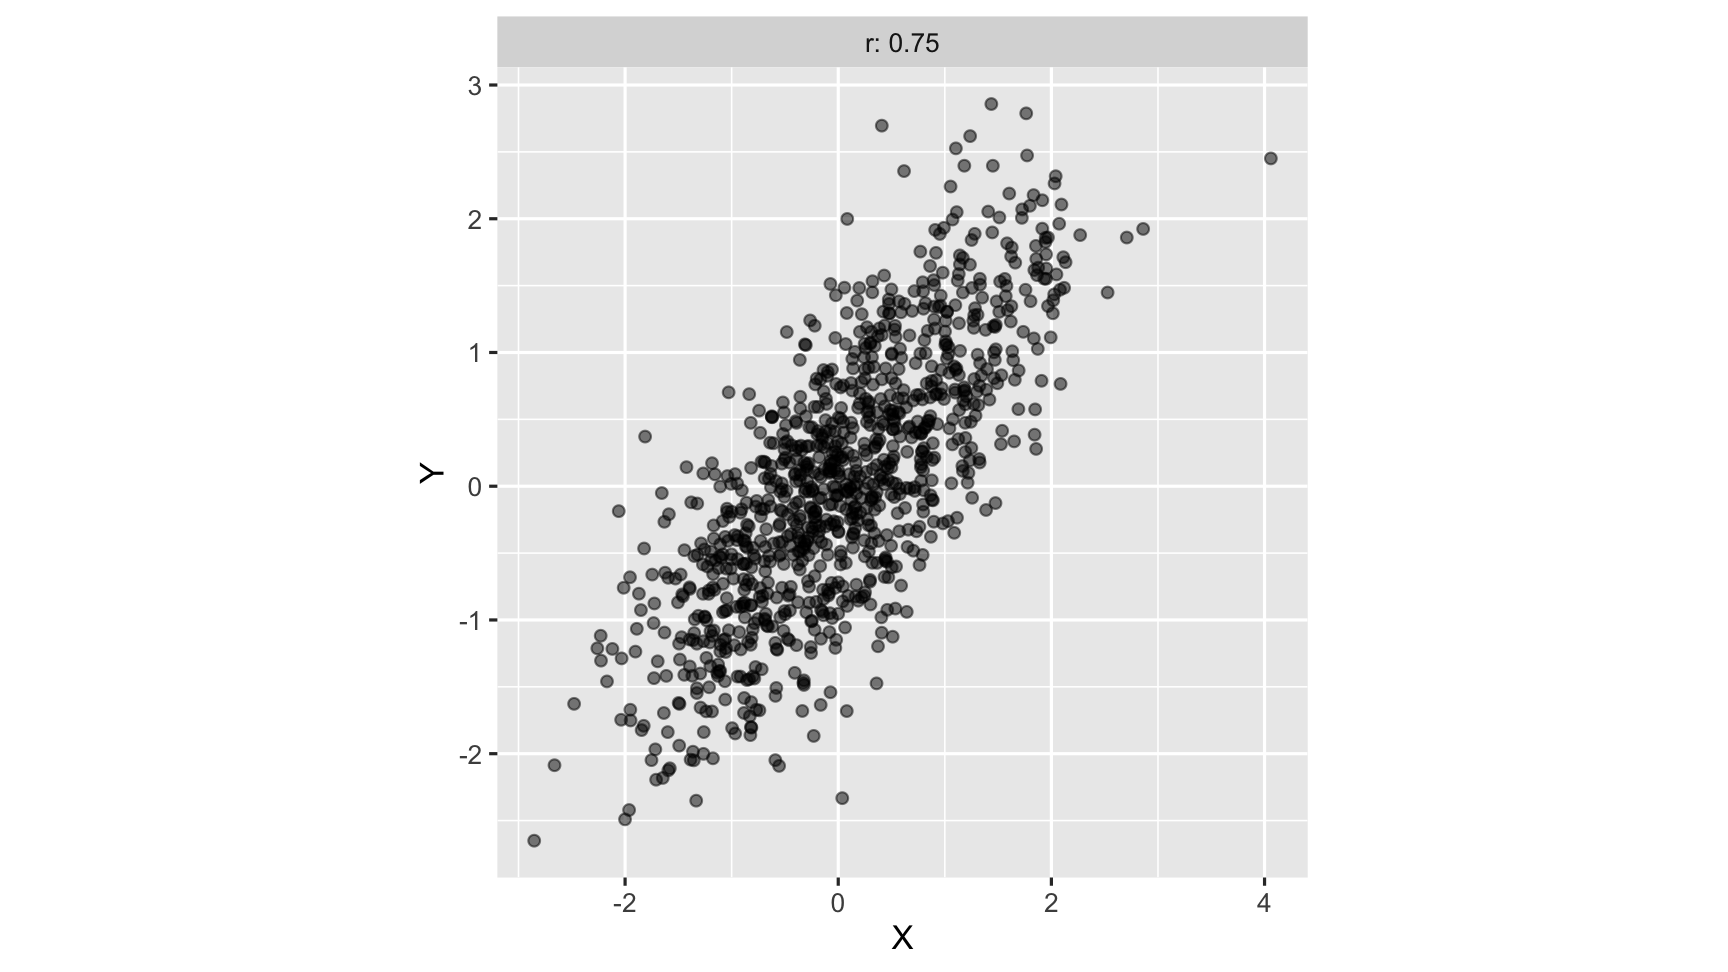
zero correlation: neither variables are related linearly
strong negative correlation: as one variable increases, another variable decreases
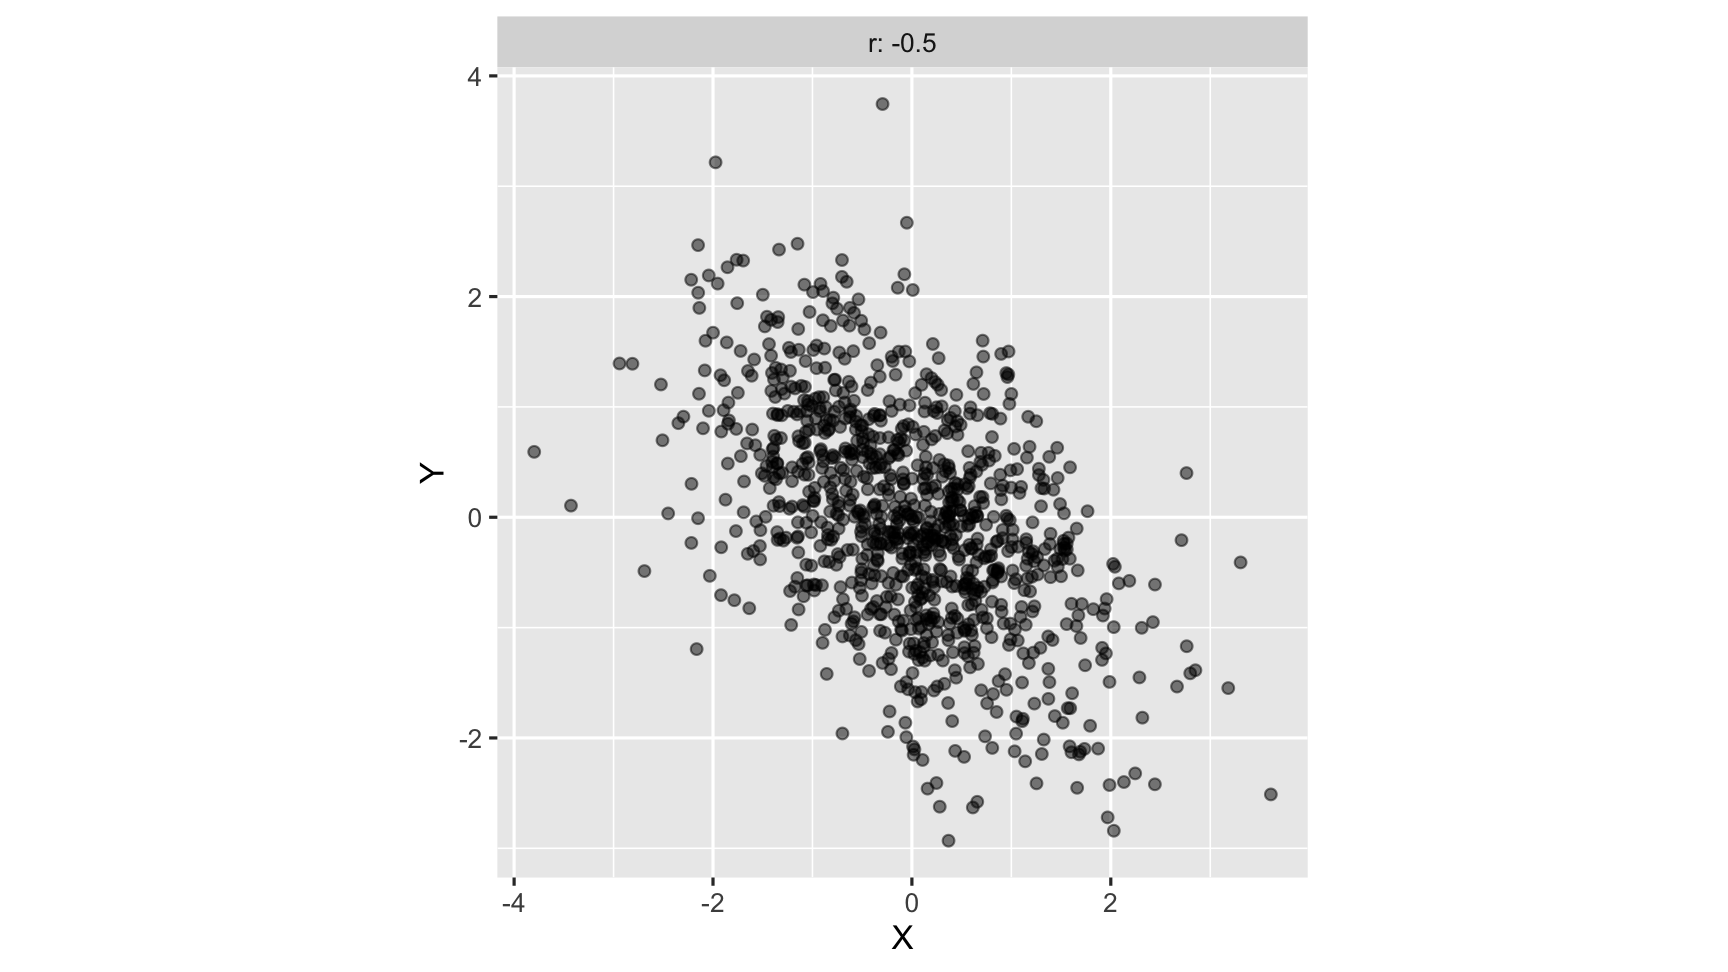
STRONG negative correlation: as one variable increases, another variable decreases
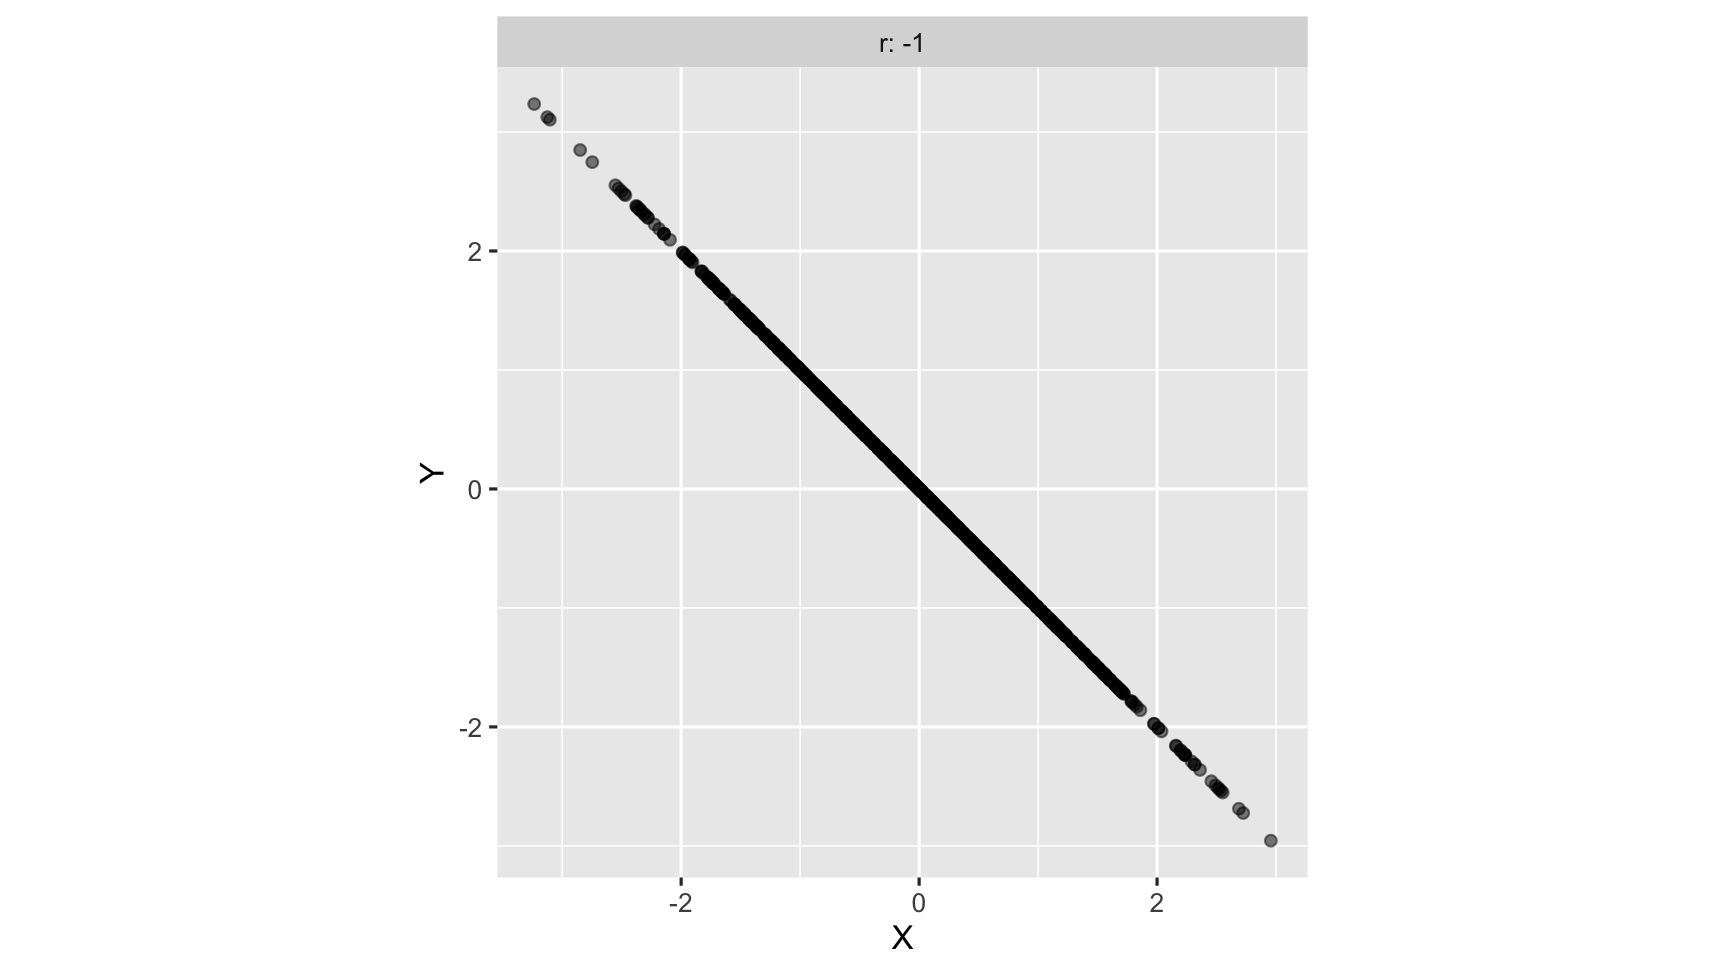
correlation: animated
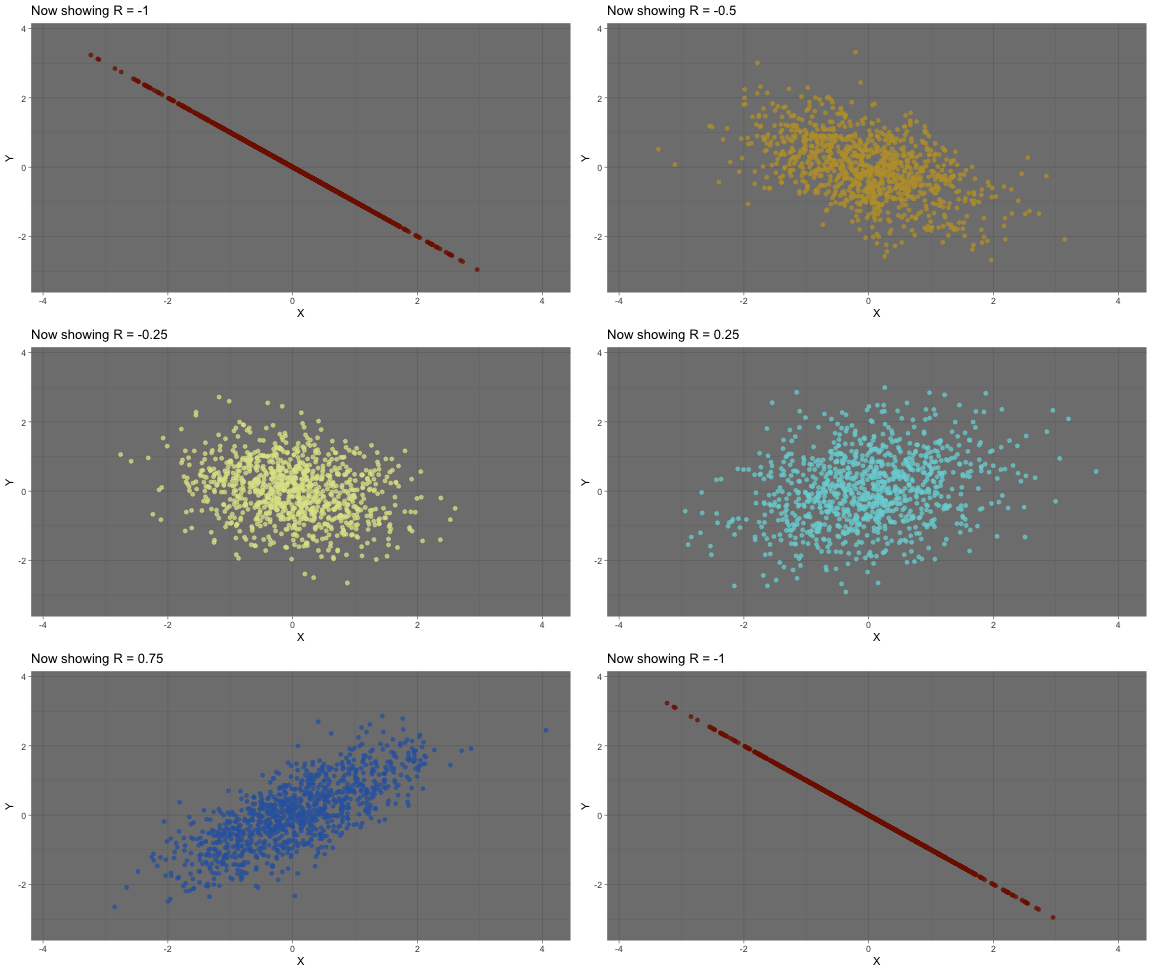
definition of correlation
For two variables X,Y, correlation is:
r=∑ni=1(xi−¯x)(yi−¯y)√∑ni=1(xi−¯x)2√∑ni=1(yi−¯y)2=cov(X,Y)sxsy
Dance of correlation
Remember! Correlation does not equal causation
What is R2?
- (model variance)/(total variance), the amount of variance in response explained by the model.
- Always ranges between 0 and 1, with 1 indicating a perfect fit.
- Adding more variables to the model will always increase R2, so what is important is how big an increase is gained. - Adjusted R2 reduces this for every additional variable added.
plots of rsquared
unpacking lm and model objects
pp <- read_csv("data/paris-paintings.csv", na = c("n/a", "", "NA"))pp## # A tibble: 3,393 x 61## name sale lot position dealer year origin_author origin_cat school_pntg## <chr> <chr> <chr> <dbl> <chr> <dbl> <chr> <chr> <chr> ## 1 L176… L1764 2 0.0328 L 1764 F O F ## 2 L176… L1764 3 0.0492 L 1764 I O I ## 3 L176… L1764 4 0.0656 L 1764 X O D/FL ## 4 L176… L1764 5 0.0820 L 1764 F O F ## 5 L176… L1764 5 0.0820 L 1764 F O F ## 6 L176… L1764 6 0.0984 L 1764 X O I ## 7 L176… L1764 7 0.115 L 1764 F O F ## 8 L176… L1764 7 0.115 L 1764 F O F ## 9 L176… L1764 8 0.131 L 1764 X O I ## 10 L176… L1764 9 0.148 L 1764 D/FL O D/FL ## # … with 3,383 more rows, and 52 more variables: diff_origin <dbl>, logprice <dbl>,## # price <dbl>, count <dbl>, subject <chr>, authorstandard <chr>, artistliving <dbl>,## # authorstyle <chr>, author <chr>, winningbidder <chr>, winningbiddertype <chr>,## # endbuyer <chr>, Interm <dbl>, type_intermed <chr>, Height_in <dbl>, Width_in <dbl>,## # Surface_Rect <dbl>, Diam_in <dbl>, Surface_Rnd <dbl>, Shape <chr>, Surface <dbl>,## # material <chr>, mat <chr>, materialCat <chr>, quantity <dbl>, nfigures <dbl>,## # engraved <dbl>, original <dbl>, prevcoll <dbl>, othartist <dbl>, paired <dbl>,## # figures <dbl>, finished <dbl>, lrgfont <dbl>, relig <dbl>, landsALL <dbl>,## # lands_sc <dbl>, lands_elem <dbl>, lands_figs <dbl>, lands_ment <dbl>, arch <dbl>,## # mytho <dbl>, peasant <dbl>, othgenre <dbl>, singlefig <dbl>, portrait <dbl>,## # still_life <dbl>, discauth <dbl>, history <dbl>, allegory <dbl>, pastorale <dbl>,## # other <dbl>unpacking linear models
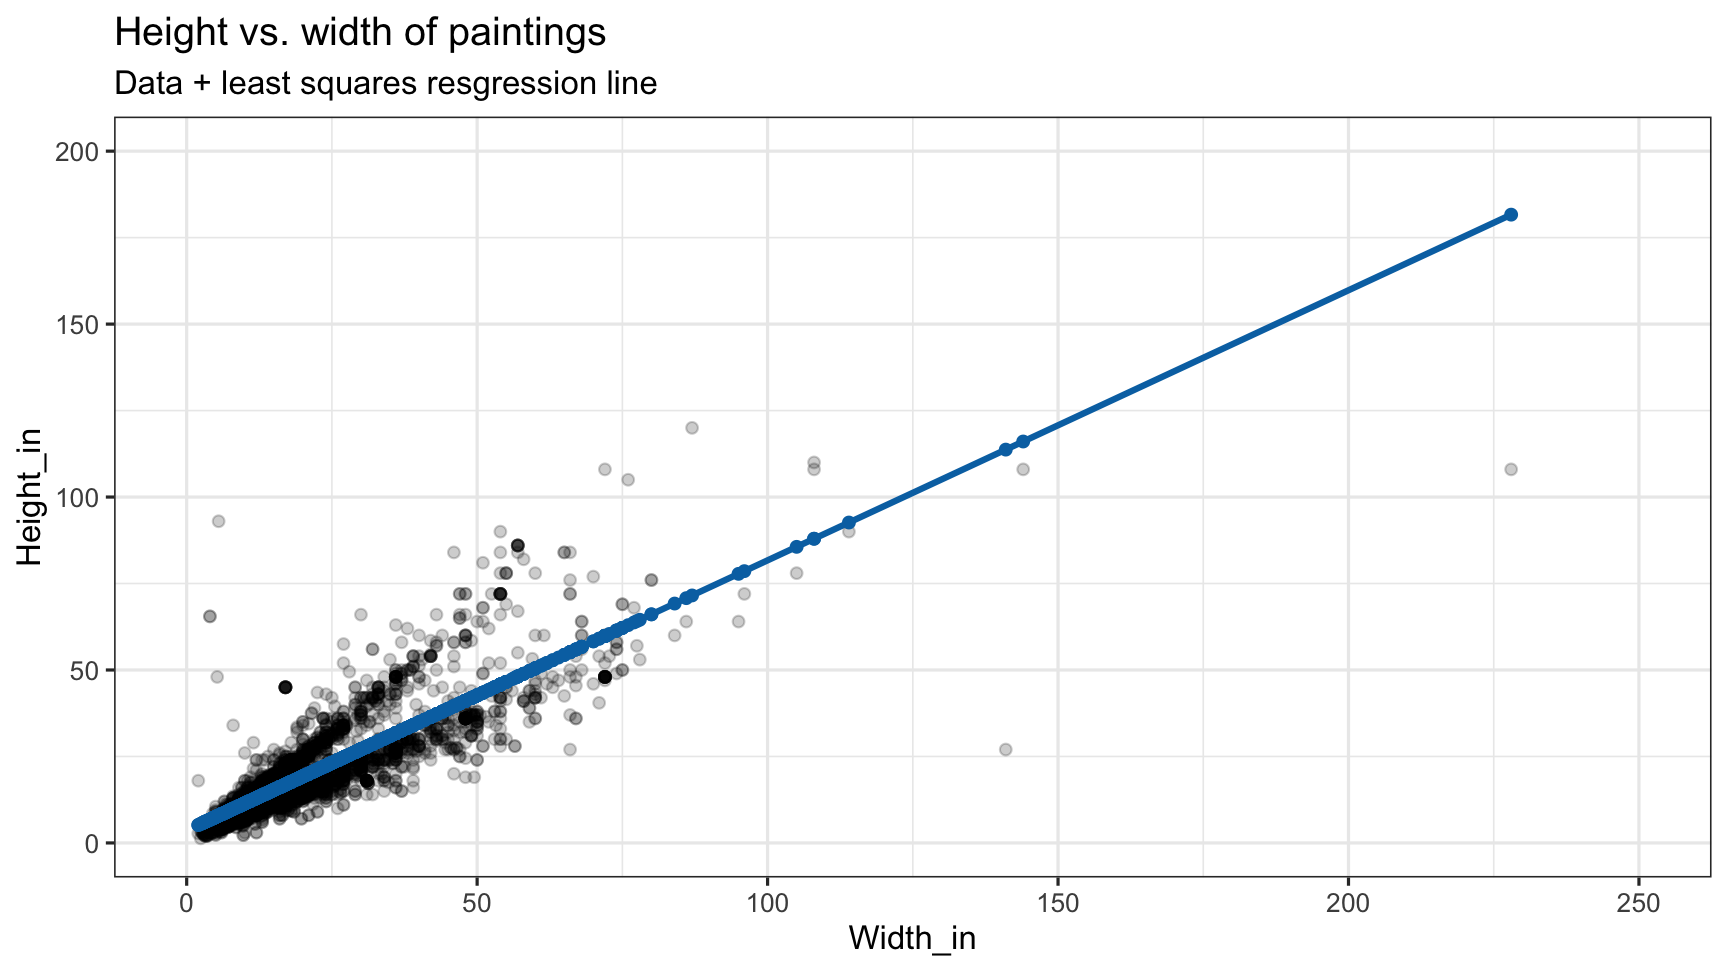
ggplot(data = pp, aes(x = Width_in, y = Height_in)) + geom_point() + geom_smooth(method = "lm") # lm for linear model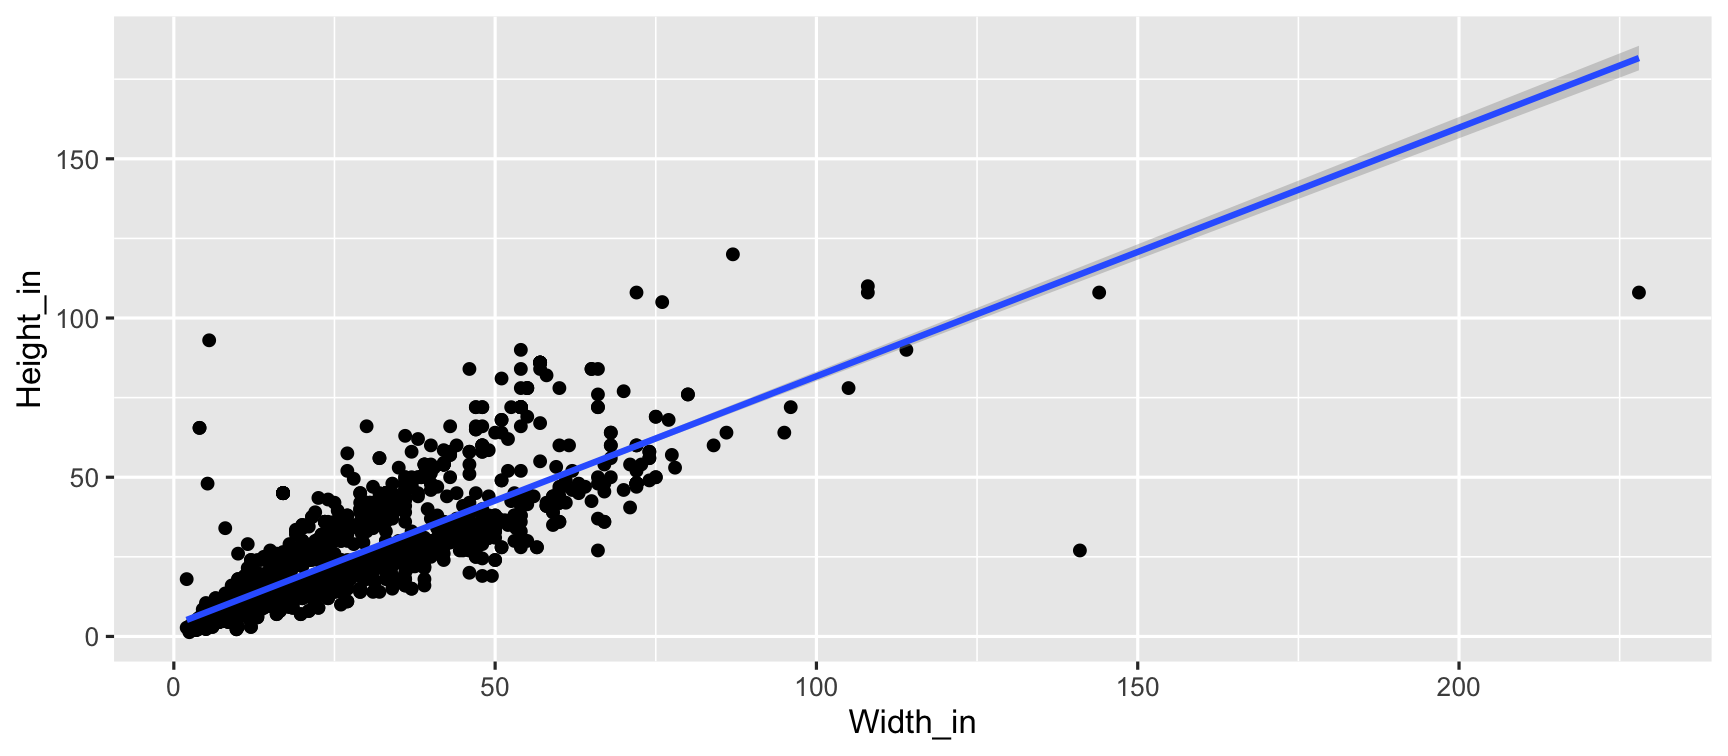
template for linear model
lm(<FORMULA>, <DATA>)
<FORMULA>
RESPONSE ~ EXPLANATORY VARIABLES
Fitting a linear model
m_ht_wt <- lm(Height_in ~ Width_in, data = pp)m_ht_wt## ## Call:## lm(formula = Height_in ~ Width_in, data = pp)## ## Coefficients:## (Intercept) Width_in ## 3.6214 0.7808using tidy, augment, glance
tidy: return a tidy table of model information
tidy(<MODEL OBJECT>)
tidy(m_ht_wt)## # A tibble: 2 x 5## term estimate std.error statistic p.value## <chr> <dbl> <dbl> <dbl> <dbl>## 1 (Intercept) 3.62 0.254 14.3 8.82e-45## 2 Width_in 0.781 0.00950 82.1 0.Visualizing residuals
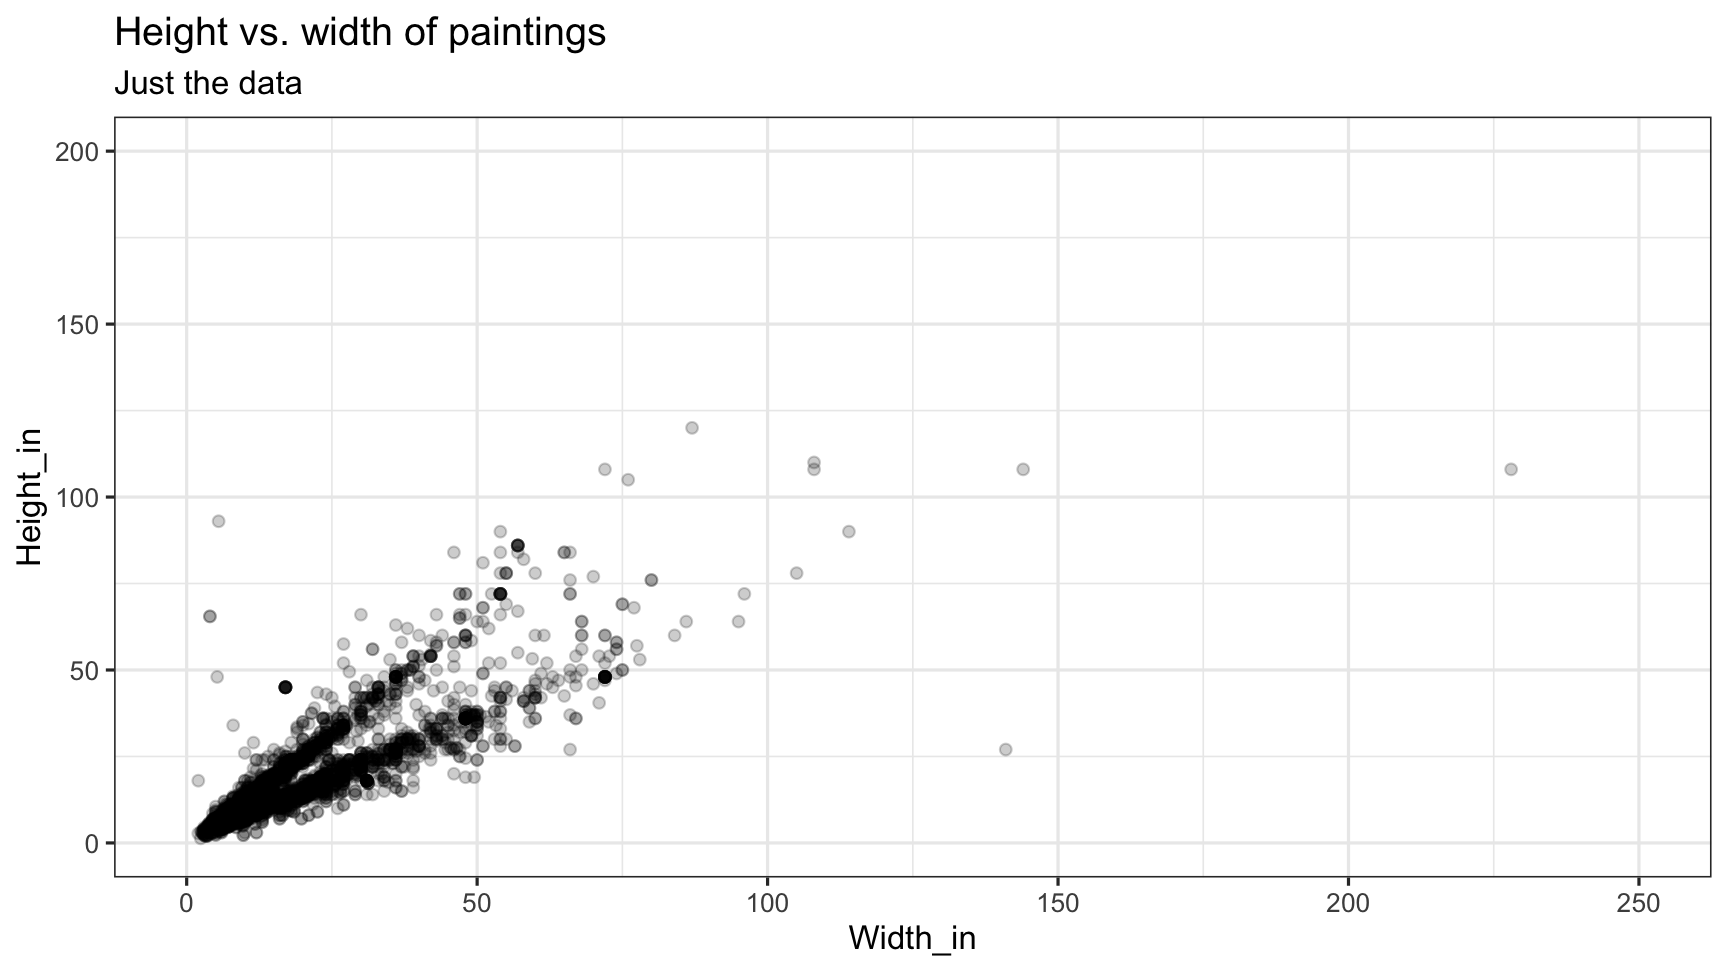
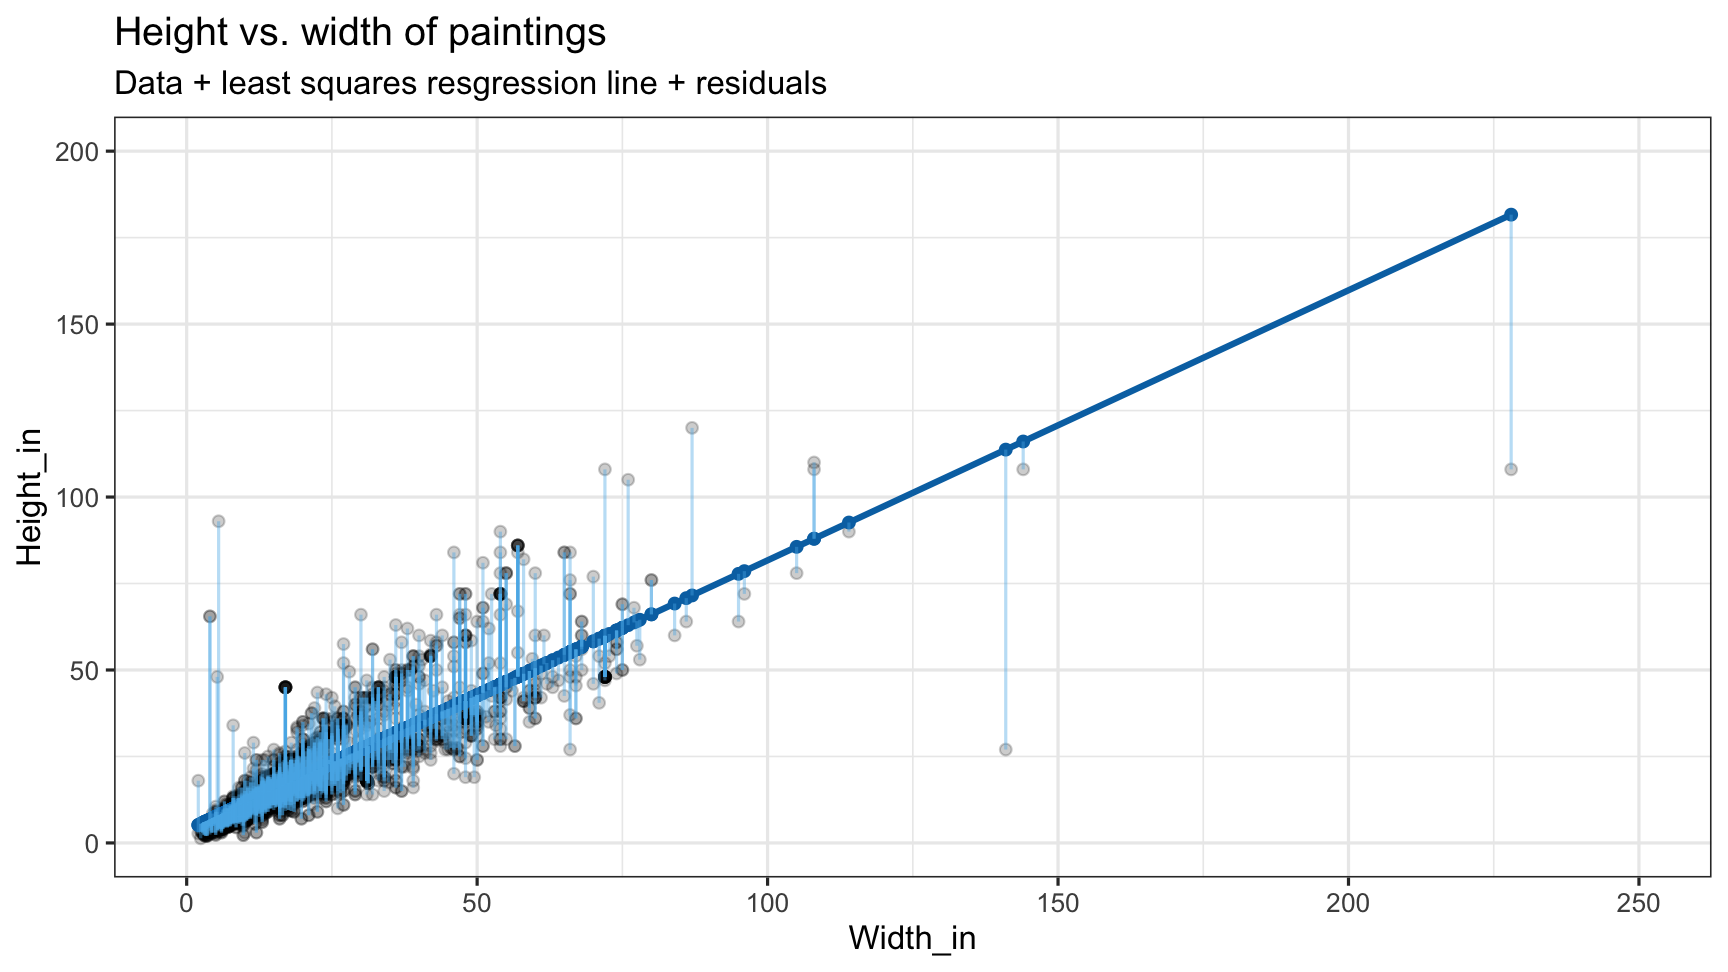
Visualizing residuals (cont.)
Visualizing residuals (cont.)
glance: get a one-row summary out
glance(<MODEL OBJECT>)
glance(m_ht_wt)## # A tibble: 1 x 11## r.squared adj.r.squared sigma statistic p.value df logLik AIC BIC deviance## <dbl> <dbl> <dbl> <dbl> <dbl> <int> <dbl> <dbl> <dbl> <dbl>## 1 0.683 0.683 8.30 6749. 0 2 -11083. 22173. 22191. 216055.## # … with 1 more variable: df.residual <int>AIC, BIC, Deviance
- AIC, BIC, and Deviance are evidence to make a decision
- Deviance is the residual variation, how much variation in response that IS NOT explained by the model. The close to 0 the better, but it is not on a standard scale. In comparing two models if one has substantially lower deviance, then it is a better model.
- Similarly BIC (Bayes Information Criterion) indicates how well the model fits, best used to compare two models. Lower is better.
augment: get the data
augment<MODEL>>
or
augment(<MODEL>, <DATA>)
augment
augment(m_ht_wt)## # A tibble: 3,135 x 10## .rownames Height_in Width_in .fitted .se.fit .resid .hat .sigma .cooksd .std.resid## <chr> <dbl> <dbl> <dbl> <dbl> <dbl> <dbl> <dbl> <dbl> <dbl>## 1 1 37 29.5 26.7 0.166 10.3 0.000399 8.30 3.10e-4 1.25 ## 2 2 18 14 14.6 0.165 3.45 0.000396 8.31 3.42e-5 0.415 ## 3 3 13 16 16.1 0.158 -3.11 0.000361 8.31 2.54e-5 -0.375 ## 4 4 14 18 17.7 0.152 -3.68 0.000337 8.31 3.30e-5 -0.443 ## 5 5 14 18 17.7 0.152 -3.68 0.000337 8.31 3.30e-5 -0.443 ## 6 6 7 10 11.4 0.185 -4.43 0.000498 8.31 7.09e-5 -0.534 ## 7 7 6 13 13.8 0.170 -7.77 0.000418 8.30 1.83e-4 -0.936 ## 8 8 6 13 13.8 0.170 -7.77 0.000418 8.30 1.83e-4 -0.936 ## 9 9 15 15 15.3 0.161 -0.333 0.000377 8.31 3.04e-7 -0.0401## 10 10 9 7 9.09 0.204 -0.0870 0.000601 8.31 3.30e-8 -0.0105## # … with 3,125 more rowsunderstanding residuals
- variation explained by the model
- residual variation: what's left over after fitting the model
Your turn: go to rstudio cloud and get started on exercise 7B
Going beyond a single model
include_graphics("images/blind-men-and-the-elephant.png")
- Beyond a single model
- Fitting many models
Image source: https://balajiviswanathan.quora.com/Lessons-from-the-Blind-men-and-the-elephant
Gapminder
- Hans Rosling was a Swedish doctor, academic and statistician, Professor of International Health at Karolinska Institute. Sadley he passed away in 2017.
- He developed a keen interest in health and wealth across the globe, and the relationship with other factors like agriculture, education, energy.
- You can play with the gapminder data using animations at https://www.gapminder.org/tools/.
R package: gapminder
Contains subset of the data on five year intervals from 1952 to 2007.
library(gapminder)glimpse(gapminder)## Observations: 1,704## Variables: 6## $ country <fct> Afghanistan, Afghanistan, Afghanistan, Afghanistan, Afghanistan, Afgh…## $ continent <fct> Asia, Asia, Asia, Asia, Asia, Asia, Asia, Asia, Asia, Asia, Asia, Asi…## $ year <int> 1952, 1957, 1962, 1967, 1972, 1977, 1982, 1987, 1992, 1997, 2002, 200…## $ lifeExp <dbl> 28.801, 30.332, 31.997, 34.020, 36.088, 38.438, 39.854, 40.822, 41.67…## $ pop <int> 8425333, 9240934, 10267083, 11537966, 13079460, 14880372, 12881816, 1…## $ gdpPercap <dbl> 779.4453, 820.8530, 853.1007, 836.1971, 739.9811, 786.1134, 978.0114,…"How has life expectancy changed over years, for each country?"
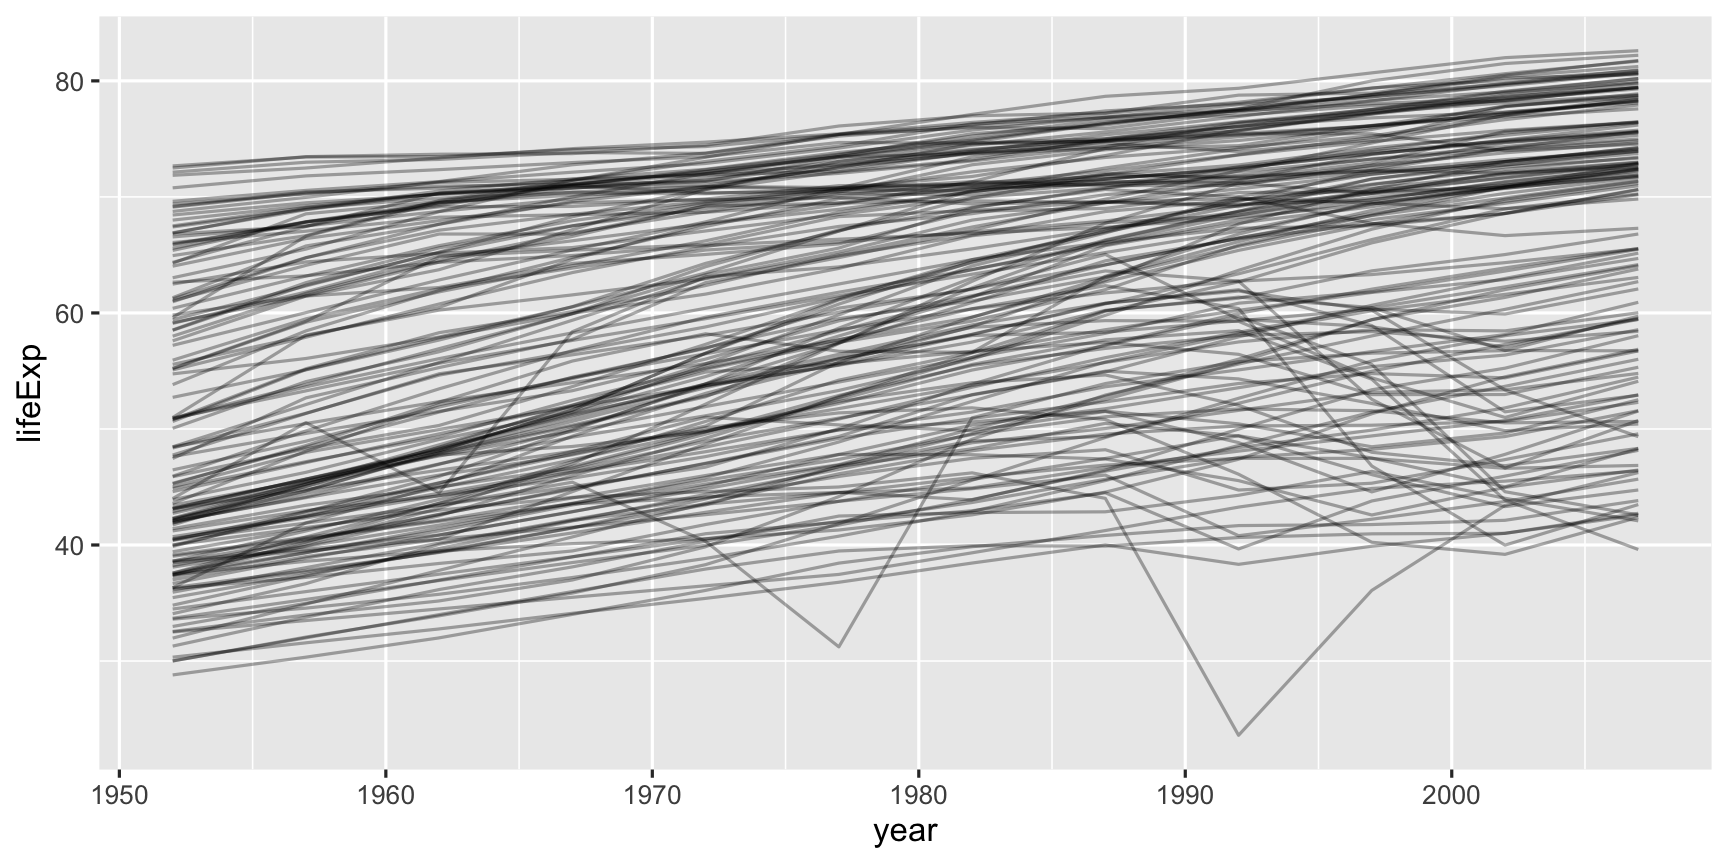
- Plot life expectancy by year, for each country.
- What do you learn?
"How has life expectancy changed over years, for each country?"
- There generally appears to be an increase in life expectancy
- A number of countries have big dips from the 70s through 90s
- a cluster of countries starts off with low life expectancy but ends up close to the highest by the end of the period.
Gapminder: Australia
Australia was already had one of the top life expectancies in the 1950s.
oz <- gapminder %>% filter(country == "Australia")oz## # A tibble: 12 x 6## country continent year lifeExp pop gdpPercap## <fct> <fct> <int> <dbl> <int> <dbl>## 1 Australia Oceania 1952 69.1 8691212 10040.## 2 Australia Oceania 1957 70.3 9712569 10950.## 3 Australia Oceania 1962 70.9 10794968 12217.## 4 Australia Oceania 1967 71.1 11872264 14526.## 5 Australia Oceania 1972 71.9 13177000 16789.## 6 Australia Oceania 1977 73.5 14074100 18334.## 7 Australia Oceania 1982 74.7 15184200 19477.## 8 Australia Oceania 1987 76.3 16257249 21889.## 9 Australia Oceania 1992 77.6 17481977 23425.## 10 Australia Oceania 1997 78.8 18565243 26998.## 11 Australia Oceania 2002 80.4 19546792 30688.## 12 Australia Oceania 2007 81.2 20434176 34435.Gapminder: Australia
ggplot(data = oz, aes(x = year, y = lifeExp)) + geom_line()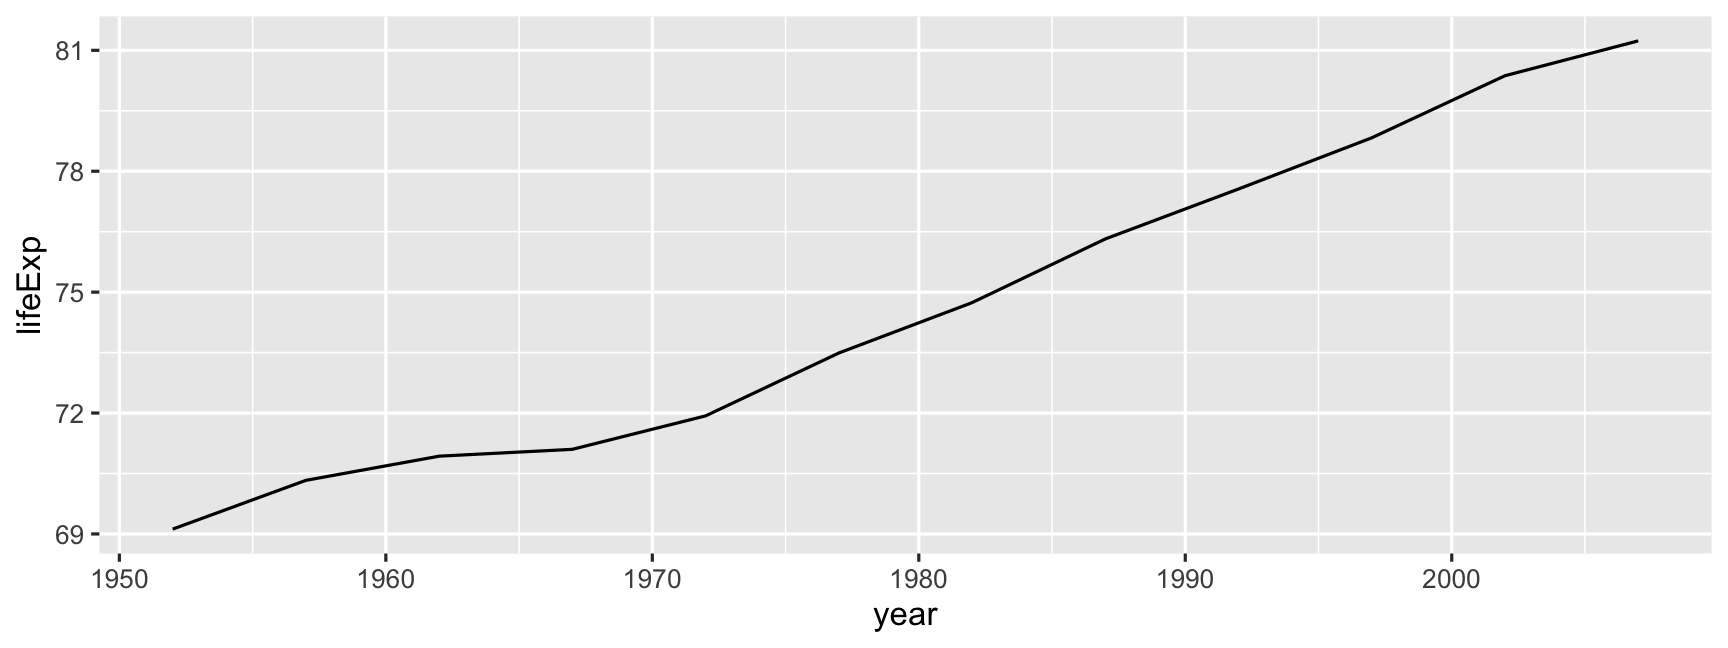
Gapminder: Australia
oz_lm <- lm(lifeExp ~ year, data = oz)oz_lm## ## Call:## lm(formula = lifeExp ~ year, data = oz)## ## Coefficients:## (Intercept) year ## -376.1163 0.2277tidy(oz_lm)## # A tibble: 2 x 5## term estimate std.error statistic p.value## <chr> <dbl> <dbl> <dbl> <dbl>## 1 (Intercept) -376. 20.5 -18.3 5.09e- 9## 2 year 0.228 0.0104 21.9 8.67e-10ˆlifeExp=−376.1163−0.2277 year
center year
Let us treat 1950 is the first year, so for model fitting we are going to shift year to begin in 1950, makes interpretability easier.
gap <- gapminder %>% mutate(year1950 = year - 1950)oz <- gap %>% filter(country == "Australia")model for centered year
oz_lm <- lm(lifeExp ~ year1950, data = oz)oz_lm## ## Call:## lm(formula = lifeExp ~ year1950, data = oz)## ## Coefficients:## (Intercept) year1950 ## 67.9451 0.2277tidy(oz_lm)## # A tibble: 2 x 5## term estimate std.error statistic p.value## <chr> <dbl> <dbl> <dbl> <dbl>## 1 (Intercept) 67.9 0.355 192. 3.70e-19## 2 year1950 0.228 0.0104 21.9 8.67e-10ˆlifeExp=67.9+0.2277 year
oz_aug <- augment(oz_lm, oz)oz_aug## # A tibble: 12 x 14## country continent year lifeExp pop gdpPercap year1950 .fitted .se.fit .resid## <fct> <fct> <int> <dbl> <int> <dbl> <dbl> <dbl> <dbl> <dbl>## 1 Austra… Oceania 1952 69.1 8.69e6 10040. 2 68.4 0.337 0.719 ## 2 Austra… Oceania 1957 70.3 9.71e6 10950. 7 69.5 0.294 0.791 ## 3 Austra… Oceania 1962 70.9 1.08e7 12217. 12 70.7 0.255 0.252 ## 4 Austra… Oceania 1967 71.1 1.19e7 14526. 17 71.8 0.221 -0.716 ## 5 Austra… Oceania 1972 71.9 1.32e7 16789. 22 73.0 0.195 -1.02 ## 6 Austra… Oceania 1977 73.5 1.41e7 18334. 27 74.1 0.181 -0.604 ## 7 Austra… Oceania 1982 74.7 1.52e7 19477. 32 75.2 0.181 -0.492 ## 8 Austra… Oceania 1987 76.3 1.63e7 21889. 37 76.4 0.195 -0.0508## 9 Austra… Oceania 1992 77.6 1.75e7 23425. 42 77.5 0.221 0.0505## 10 Austra… Oceania 1997 78.8 1.86e7 26998. 47 78.6 0.255 0.182 ## 11 Austra… Oceania 2002 80.4 1.95e7 30688. 52 79.8 0.294 0.583 ## 12 Austra… Oceania 2007 81.2 2.04e7 34435. 57 80.9 0.337 0.310 ## # … with 4 more variables: .hat <dbl>, .sigma <dbl>, .cooksd <dbl>, .std.resid <dbl>ggplot(data = oz_aug, aes(x = year, y = .fitted)) + geom_line(colour = "blue") + geom_point(aes(x = year, y = lifeExp))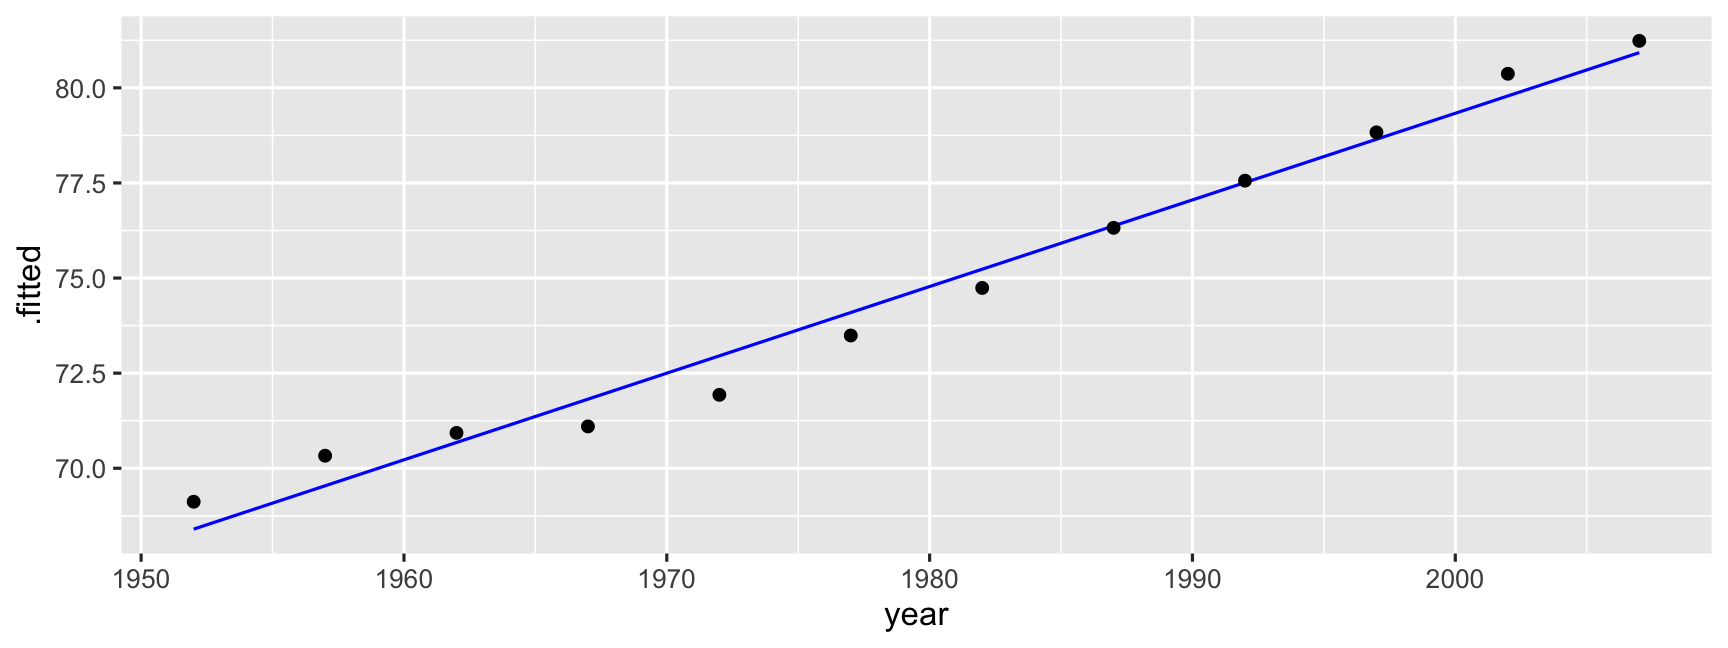
ggplot(data = oz_aug, aes(x = year, y = .std.resid)) + geom_hline(yintercept = 0, colour = "white", size = 2) + geom_line()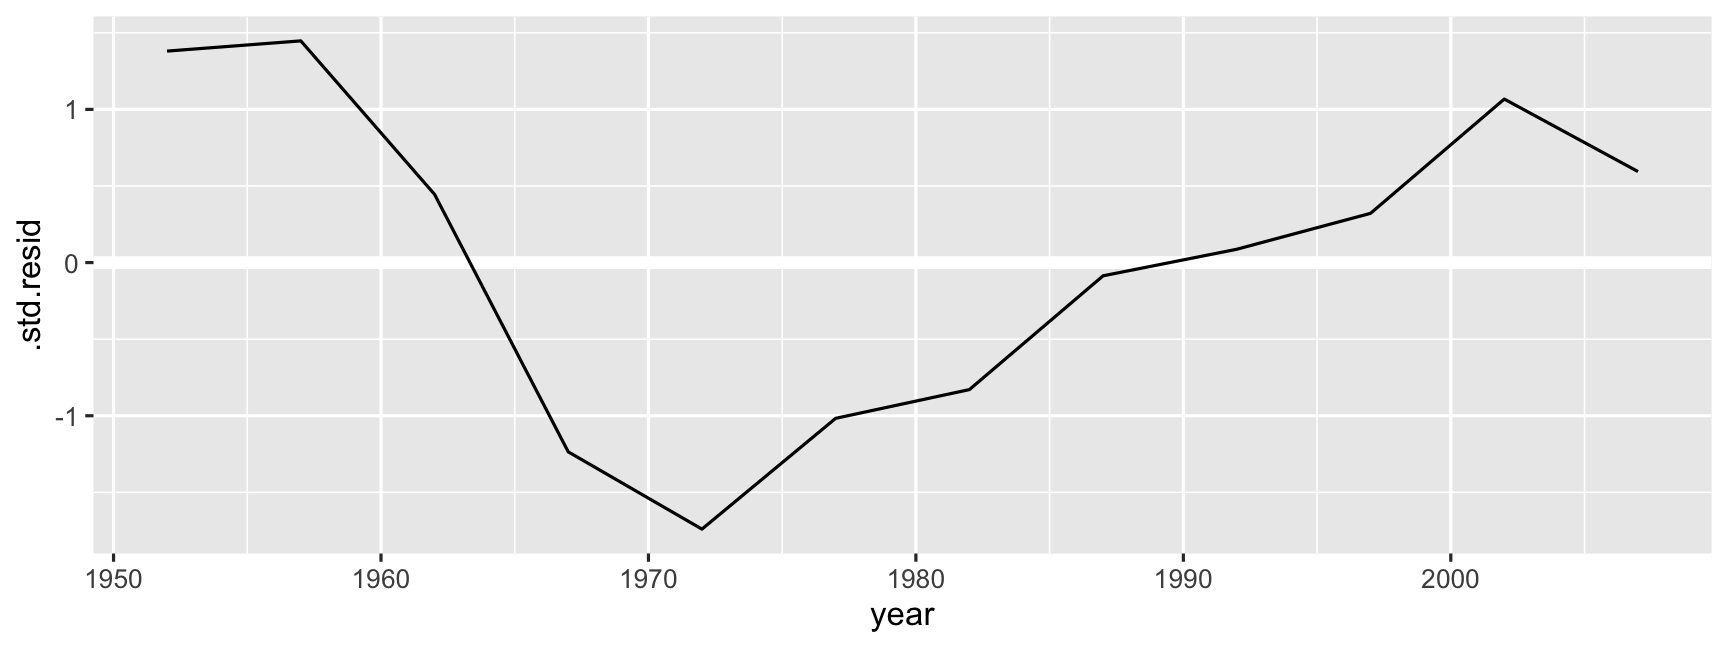
Making inferences from this
- Life expectancy has increased 2.3 years every decade, on average.
- There was a slow period from 1960 through to 1972, probably related to mortality during the Vietnam war.
Can we fit for New Zealand?
nz <- gap %>% filter(country == "New Zealand")nz_lm <- lm(lifeExp ~ year1950, data = nz)nz_lm## ## Call:## lm(formula = lifeExp ~ year1950, data = nz)## ## Coefficients:## (Intercept) year1950 ## 68.3013 0.1928Can we fit for Japan?
japan <- gap %>% filter(country == "Japan")japan_lm <- lm(lifeExp ~ year1950, data = japan)japan_lm## ## Call:## lm(formula = lifeExp ~ year1950, data = japan)## ## Coefficients:## (Intercept) year1950 ## 64.4162 0.3529Can we fit for italy?
italy <- gap %>% filter(country == "Italy")italy_lm <- lm(lifeExp ~ year1950, data = italy)italy_lm## ## Call:## lm(formula = lifeExp ~ year1950, data = italy)## ## Coefficients:## (Intercept) year1950 ## 66.0574 0.2697Is there a better way?
Is there a better way?
Like, what if we wanted to fit a model for ALL countries?
Is there a better way?
Like, what if we wanted to fit a model for ALL countries?
Let's tinker with the data.
nest country level data (one row = one country)
by_country <- gap %>% select(country, year1950, lifeExp, continent) %>% group_by(country, continent) %>% nest()by_country## # A tibble: 142 x 3## country continent data ## <fct> <fct> <list> ## 1 Afghanistan Asia <tibble [12 × 2]>## 2 Albania Europe <tibble [12 × 2]>## 3 Algeria Africa <tibble [12 × 2]>## 4 Angola Africa <tibble [12 × 2]>## 5 Argentina Americas <tibble [12 × 2]>## 6 Australia Oceania <tibble [12 × 2]>## 7 Austria Europe <tibble [12 × 2]>## 8 Bahrain Asia <tibble [12 × 2]>## 9 Bangladesh Asia <tibble [12 × 2]>## 10 Belgium Europe <tibble [12 × 2]>## # … with 132 more rowsWhat is in data?
by_country$data[[1]]## # A tibble: 12 x 2## year1950 lifeExp## <dbl> <dbl>## 1 2 28.8## 2 7 30.3## 3 12 32.0## 4 17 34.0## 5 22 36.1## 6 27 38.4## 7 32 39.9## 8 37 40.8## 9 42 41.7## 10 47 41.8## 11 52 42.1## 12 57 43.8What is in data?
by_country$data[[1]]## # A tibble: 12 x 2## year1950 lifeExp## <dbl> <dbl>## 1 2 28.8## 2 7 30.3## 3 12 32.0## 4 17 34.0## 5 22 36.1## 6 27 38.4## 7 32 39.9## 8 37 40.8## 9 42 41.7## 10 47 41.8## 11 52 42.1## 12 57 43.8It's a list!
fit a linear model to each one?
lm_afganistan <- lm(lifeExp ~ year1950, data = by_country$data[[1]])lm_albania <- lm(lifeExp ~ year1950, data = by_country$data[[2]])lm_algeria <- lm(lifeExp ~ year1950, data = by_country$data[[3]])fit a linear model to each one?
lm_afganistan <- lm(lifeExp ~ year1950, data = by_country$data[[1]])lm_albania <- lm(lifeExp ~ year1950, data = by_country$data[[2]])lm_algeria <- lm(lifeExp ~ year1950, data = by_country$data[[3]])But we are copying and pasting this code more than twice...is there a better way?
A case for map???
map(<data object>, <function>)
A case for map???
mapped_lm <- map(by_country$data, function(x){ lm(lifeExp ~ year1950, data = x) })mapped_lm## [[1]]## ## Call:## lm(formula = lifeExp ~ year1950, data = x)## ## Coefficients:## (Intercept) year1950 ## 29.3566 0.2753 ## ## ## [[2]]## ## Call:## lm(formula = lifeExp ~ year1950, data = x)## ## Coefficients:## (Intercept) year1950 ## 58.5598 0.3347 ## ## ## [[3]]## ## Call:## lm(formula = lifeExp ~ year1950, data = x)## ## Coefficients:## (Intercept) year1950 ## 42.2364 0.5693 ## ## ## [[4]]## ## Call:## lm(formula = lifeExp ~ year1950, data = x)## ## Coefficients:## (Intercept) year1950 ## 31.7080 0.2093 ## ## ## [[5]]## ## Call:## lm(formula = lifeExp ~ year1950, data = x)## ## Coefficients:## (Intercept) year1950 ## 62.2250 0.2317 ## ## ## [[6]]## ## Call:## lm(formula = lifeExp ~ year1950, data = x)## ## Coefficients:## (Intercept) year1950 ## 67.9451 0.2277 ## ## ## [[7]]## ## Call:## lm(formula = lifeExp ~ year1950, data = x)## ## Coefficients:## (Intercept) year1950 ## 65.964 0.242 ## ## ## [[8]]## ## Call:## lm(formula = lifeExp ~ year1950, data = x)## ## Coefficients:## (Intercept) year1950 ## 51.8142 0.4675 ## ## ## [[9]]## ## Call:## lm(formula = lifeExp ~ year1950, data = x)## ## Coefficients:## (Intercept) year1950 ## 35.1392 0.4981 ## ## ## [[10]]## ## Call:## lm(formula = lifeExp ~ year1950, data = x)## ## Coefficients:## (Intercept) year1950 ## 67.4738 0.2091 ## ## ## [[11]]## ## Call:## lm(formula = lifeExp ~ year1950, data = x)## ## Coefficients:## (Intercept) year1950 ## 38.9200 0.3342 ## ## ## [[12]]## ## Call:## lm(formula = lifeExp ~ year1950, data = x)## ## Coefficients:## (Intercept) year1950 ## 37.7566 0.4999 ## ## ## [[13]]## ## Call:## lm(formula = lifeExp ~ year1950, data = x)## ## Coefficients:## (Intercept) year1950 ## 57.3901 0.3498 ## ## ## [[14]]## ## Call:## lm(formula = lifeExp ~ year1950, data = x)## ## Coefficients:## (Intercept) year1950 ## 52.80778 0.06067 ## ## ## [[15]]## ## Call:## lm(formula = lifeExp ~ year1950, data = x)## ## Coefficients:## (Intercept) year1950 ## 50.7319 0.3901 ## ## ## [[16]]## ## Call:## lm(formula = lifeExp ~ year1950, data = x)## ## Coefficients:## (Intercept) year1950 ## 65.4459 0.1457 ## ## ## [[17]]## ## Call:## lm(formula = lifeExp ~ year1950, data = x)## ## Coefficients:## (Intercept) year1950 ## 33.957 0.364 ## ## ## [[18]]## ## Call:## lm(formula = lifeExp ~ year1950, data = x)## ## Coefficients:## (Intercept) year1950 ## 40.2704 0.1541 ## ## ## [[19]]## ## Call:## lm(formula = lifeExp ~ year1950, data = x)## ## Coefficients:## (Intercept) year1950 ## 36.2236 0.3959 ## ## ## [[20]]## ## Call:## lm(formula = lifeExp ~ year1950, data = x)## ## Coefficients:## (Intercept) year1950 ## 40.7492 0.2501 ## ## ## [[21]]## ## Call:## lm(formula = lifeExp ~ year1950, data = x)## ## Coefficients:## (Intercept) year1950 ## 68.4461 0.2189 ## ## ## [[22]]## ## Call:## lm(formula = lifeExp ~ year1950, data = x)## ## Coefficients:## (Intercept) year1950 ## 38.4417 0.1839 ## ## ## [[23]]## ## Call:## lm(formula = lifeExp ~ year1950, data = x)## ## Coefficients:## (Intercept) year1950 ## 39.3029 0.2532 ## ## ## [[24]]## ## Call:## lm(formula = lifeExp ~ year1950, data = x)## ## Coefficients:## (Intercept) year1950 ## 53.3640 0.4768 ## ## ## [[25]]## ## Call:## lm(formula = lifeExp ~ year1950, data = x)## ## Coefficients:## (Intercept) year1950 ## 46.1291 0.5307 ## ## ## [[26]]## ## Call:## lm(formula = lifeExp ~ year1950, data = x)## ## Coefficients:## (Intercept) year1950 ## 52.6656 0.3808 ## ## ## [[27]]## ## Call:## lm(formula = lifeExp ~ year1950, data = x)## ## Coefficients:## (Intercept) year1950 ## 39.0952 0.4504 ## ## ## [[28]]## ## Call:## lm(formula = lifeExp ~ year1950, data = x)## ## Coefficients:## (Intercept) year1950 ## 41.77325 0.09392 ## ## ## [[29]]## ## Call:## lm(formula = lifeExp ~ year1950, data = x)## ## Coefficients:## (Intercept) year1950 ## 46.7466 0.1951 ## ## ## [[30]]## ## Call:## lm(formula = lifeExp ~ year1950, data = x)## ## Coefficients:## (Intercept) year1950 ## 58.2991 0.4028 ## ## ## [[31]]## ## Call:## lm(formula = lifeExp ~ year1950, data = x)## ## Coefficients:## (Intercept) year1950 ## 44.5847 0.1306 ## ## ## [[32]]## ## Call:## lm(formula = lifeExp ~ year1950, data = x)## ## Coefficients:## (Intercept) year1950 ## 63.4049 0.2255 ## ## ## [[33]]## ## Call:## lm(formula = lifeExp ~ year1950, data = x)## ## Coefficients:## (Intercept) year1950 ## 61.5711 0.3212 ## ## ## [[34]]## ## Call:## lm(formula = lifeExp ~ year1950, data = x)## ## Coefficients:## (Intercept) year1950 ## 67.2384 0.1448 ## ## ## [[35]]## ## Call:## lm(formula = lifeExp ~ year1950, data = x)## ## Coefficients:## (Intercept) year1950 ## 70.7909 0.1213 ## ## ## [[36]]## ## Call:## lm(formula = lifeExp ~ year1950, data = x)## ## Coefficients:## (Intercept) year1950 ## 35.5423 0.3674 ## ## ## [[37]]## ## Call:## lm(formula = lifeExp ~ year1950, data = x)## ## Coefficients:## (Intercept) year1950 ## 47.6555 0.4712 ## ## ## [[38]]## ## Call:## lm(formula = lifeExp ~ year1950, data = x)## ## Coefficients:## (Intercept) year1950 ## 48.0653 0.5001 ## ## ## [[39]]## ## Call:## lm(formula = lifeExp ~ year1950, data = x)## ## Coefficients:## (Intercept) year1950 ## 39.8571 0.5555 ## ## ## [[40]]## ## Call:## lm(formula = lifeExp ~ year1950, data = x)## ## Coefficients:## (Intercept) year1950 ## 45.5577 0.4771 ## ## ## [[41]]## ## Call:## lm(formula = lifeExp ~ year1950, data = x)## ## Coefficients:## (Intercept) year1950 ## 33.8100 0.3102 ## ## ## [[42]]## ## Call:## lm(formula = lifeExp ~ year1950, data = x)## ## Coefficients:## (Intercept) year1950 ## 34.9459 0.3747 ## ## ## [[43]]## ## Call:## lm(formula = lifeExp ~ year1950, data = x)## ## Coefficients:## (Intercept) year1950 ## 35.4138 0.3072 ## ## ## [[44]]## ## Call:## lm(formula = lifeExp ~ year1950, data = x)## ## Coefficients:## (Intercept) year1950 ## 65.9731 0.2379 ## ## ## [[45]]## ## Call:## lm(formula = lifeExp ~ year1950, data = x)## ## Coefficients:## (Intercept) year1950 ## 67.3131 0.2385 ## ## ## [[46]]## ## Call:## lm(formula = lifeExp ~ year1950, data = x)## ## Coefficients:## (Intercept) year1950 ## 38.0419 0.4467 ## ## ## [[47]]## ## Call:## lm(formula = lifeExp ~ year1950, data = x)## ## Coefficients:## (Intercept) year1950 ## 27.2367 0.5818 ## ## ## [[48]]## ## Call:## lm(formula = lifeExp ~ year1950, data = x)## ## Coefficients:## (Intercept) year1950 ## 67.1408 0.2137 ## ## ## [[49]]## ## Call:## lm(formula = lifeExp ~ year1950, data = x)## ## Coefficients:## (Intercept) year1950 ## 42.8493 0.3217 ## ## ## [[50]]## ## Call:## lm(formula = lifeExp ~ year1950, data = x)## ## Coefficients:## (Intercept) year1950 ## 66.5824 0.2424 ## ## ## [[51]]## ## Call:## lm(formula = lifeExp ~ year1950, data = x)## ## Coefficients:## (Intercept) year1950 ## 41.0569 0.5313 ## ## ## [[52]]## ## Call:## lm(formula = lifeExp ~ year1950, data = x)## ## Coefficients:## (Intercept) year1950 ## 30.7073 0.4248 ## ## ## [[53]]## ## Call:## lm(formula = lifeExp ~ year1950, data = x)## ## Coefficients:## (Intercept) year1950 ## 31.1935 0.2718 ## ## ## [[54]]## ## Call:## lm(formula = lifeExp ~ year1950, data = x)## ## Coefficients:## (Intercept) year1950 ## 38.4520 0.3971 ## ## ## [[55]]## ## Call:## lm(formula = lifeExp ~ year1950, data = x)## ## Coefficients:## (Intercept) year1950 ## 41.9067 0.5429 ## ## ## [[56]]## ## Call:## lm(formula = lifeExp ~ year1950, data = x)## ## Coefficients:## (Intercept) year1950 ## 62.697 0.366 ## ## ## [[57]]## ## Call:## lm(formula = lifeExp ~ year1950, data = x)## ## Coefficients:## (Intercept) year1950 ## 65.7455 0.1236 ## ## ## [[58]]## ## Call:## lm(formula = lifeExp ~ year1950, data = x)## ## Coefficients:## (Intercept) year1950 ## 71.6328 0.1654 ## ## ## [[59]]## ## Call:## lm(formula = lifeExp ~ year1950, data = x)## ## Coefficients:## (Intercept) year1950 ## 38.2591 0.5053 ## ## ## [[60]]## ## Call:## lm(formula = lifeExp ~ year1950, data = x)## ## Coefficients:## (Intercept) year1950 ## 35.6138 0.6346 ## ## ## [[61]]## ## Call:## lm(formula = lifeExp ~ year1950, data = x)## ## Coefficients:## (Intercept) year1950 ## 43.9857 0.4966 ## ## ## [[62]]## ## Call:## lm(formula = lifeExp ~ year1950, data = x)## ## Coefficients:## (Intercept) year1950 ## 49.6430 0.2352 ## ## ## [[63]]## ## Call:## lm(formula = lifeExp ~ year1950, data = x)## ## Coefficients:## (Intercept) year1950 ## 67.1432 0.1991 ## ## ## [[64]]## ## Call:## lm(formula = lifeExp ~ year1950, data = x)## ## Coefficients:## (Intercept) year1950 ## 65.7662 0.2671 ## ## ## [[65]]## ## Call:## lm(formula = lifeExp ~ year1950, data = x)## ## Coefficients:## (Intercept) year1950 ## 66.0574 0.2697 ## ## ## [[66]]## ## Call:## lm(formula = lifeExp ~ year1950, data = x)## ## Coefficients:## (Intercept) year1950 ## 62.2182 0.2214 ## ## ## [[67]]## ## Call:## lm(formula = lifeExp ~ year1950, data = x)## ## Coefficients:## (Intercept) year1950 ## 64.4162 0.3529 ## ## ## [[68]]## ## Call:## lm(formula = lifeExp ~ year1950, data = x)## ## Coefficients:## (Intercept) year1950 ## 42.9204 0.5717 ## ## ## [[69]]## ## Call:## lm(formula = lifeExp ~ year1950, data = x)## ## Coefficients:## (Intercept) year1950 ## 46.5890 0.2065 ## ## ## [[70]]## ## Call:## lm(formula = lifeExp ~ year1950, data = x)## ## Coefficients:## (Intercept) year1950 ## 54.2727 0.3164 ## ## ## [[71]]## ## Call:## lm(formula = lifeExp ~ year1950, data = x)## ## Coefficients:## (Intercept) year1950 ## 48.6167 0.5554 ## ## ## [[72]]## ## Call:## lm(formula = lifeExp ~ year1950, data = x)## ## Coefficients:## (Intercept) year1950 ## 56.6257 0.4168 ## ## ## [[73]]## ## Call:## lm(formula = lifeExp ~ year1950, data = x)## ## Coefficients:## (Intercept) year1950 ## 58.165 0.261 ## ## ## [[74]]## ## Call:## lm(formula = lifeExp ~ year1950, data = x)## ## Coefficients:## (Intercept) year1950 ## 47.18789 0.09557 ## ## ## [[75]]## ## Call:## lm(formula = lifeExp ~ year1950, data = x)## ## Coefficients:## (Intercept) year1950 ## 39.64444 0.09599 ## ## ## [[76]]## ## Call:## lm(formula = lifeExp ~ year1950, data = x)## ## Coefficients:## (Intercept) year1950 ## 40.8509 0.6255 ## ## ## [[77]]## ## Call:## lm(formula = lifeExp ~ year1950, data = x)## ## Coefficients:## (Intercept) year1950 ## 35.8606 0.4037 ## ## ## [[78]]## ## Call:## lm(formula = lifeExp ~ year1950, data = x)## ## Coefficients:## (Intercept) year1950 ## 36.4419 0.2342 ## ## ## [[79]]## ## Call:## lm(formula = lifeExp ~ year1950, data = x)## ## Coefficients:## (Intercept) year1950 ## 50.5762 0.4645 ## ## ## [[80]]## ## Call:## lm(formula = lifeExp ~ year1950, data = x)## ## Coefficients:## (Intercept) year1950 ## 32.2976 0.3768 ## ## ## [[81]]## ## Call:## lm(formula = lifeExp ~ year1950, data = x)## ## Coefficients:## (Intercept) year1950 ## 39.1328 0.4464 ## ## ## [[82]]## ## Call:## lm(formula = lifeExp ~ year1950, data = x)## ## Coefficients:## (Intercept) year1950 ## 54.6739 0.3485 ## ## ## [[83]]## ## Call:## lm(formula = lifeExp ~ year1950, data = x)## ## Coefficients:## (Intercept) year1950 ## 52.103 0.451 ## ## ## [[84]]## ## Call:## lm(formula = lifeExp ~ year1950, data = x)## ## Coefficients:## (Intercept) year1950 ## 42.9490 0.4387 ## ## ## [[85]]## ## Call:## lm(formula = lifeExp ~ year1950, data = x)## ## Coefficients:## (Intercept) year1950 ## 61.656 0.293 ## ## ## [[86]]## ## Call:## lm(formula = lifeExp ~ year1950, data = x)## ## Coefficients:## (Intercept) year1950 ## 41.6059 0.5425 ## ## ## [[87]]## ## Call:## lm(formula = lifeExp ~ year1950, data = x)## ## Coefficients:## (Intercept) year1950 ## 33.7572 0.2245 ## ## ## [[88]]## ## Call:## lm(formula = lifeExp ~ year1950, data = x)## ## Coefficients:## (Intercept) year1950 ## 40.5454 0.4331 ## ## ## [[89]]## ## Call:## lm(formula = lifeExp ~ year1950, data = x)## ## Coefficients:## (Intercept) year1950 ## 46.6720 0.2312 ## ## ## [[90]]## ## Call:## lm(formula = lifeExp ~ year1950, data = x)## ## Coefficients:## (Intercept) year1950 ## 33.3731 0.5293 ## ## ## [[91]]## ## Call:## lm(formula = lifeExp ~ year1950, data = x)## ## Coefficients:## (Intercept) year1950 ## 71.6162 0.1367 ## ## ## [[92]]## ## Call:## lm(formula = lifeExp ~ year1950, data = x)## ## Coefficients:## (Intercept) year1950 ## 68.3013 0.1928 ## ## ## [[93]]## ## Call:## lm(formula = lifeExp ~ year1950, data = x)## ## Coefficients:## (Intercept) year1950 ## 41.9321 0.5565 ## ## ## [[94]]## ## Call:## lm(formula = lifeExp ~ year1950, data = x)## ## Coefficients:## (Intercept) year1950 ## 34.4664 0.3421 ## ## ## [[95]]## ## Call:## lm(formula = lifeExp ~ year1950, data = x)## ## Coefficients:## (Intercept) year1950 ## 37.4434 0.2081 ## ## ## [[96]]## ## Call:## lm(formula = lifeExp ~ year1950, data = x)## ## Coefficients:## (Intercept) year1950 ## 71.9507 0.1319 ## ## ## [[97]]## ## Call:## lm(formula = lifeExp ~ year1950, data = x)## ## Coefficients:## (Intercept) year1950 ## 35.6634 0.7722 ## ## ## [[98]]## ## Call:## lm(formula = lifeExp ~ year1950, data = x)## ## Coefficients:## (Intercept) year1950 ## 42.9114 0.4058 ## ## ## [[99]]## ## Call:## lm(formula = lifeExp ~ year1950, data = x)## ## Coefficients:## (Intercept) year1950 ## 57.3526 0.3542 ## ## ## [[100]]## ## Call:## lm(formula = lifeExp ~ year1950, data = x)## ## Coefficients:## (Intercept) year1950 ## 62.1671 0.1574 ## ## ## [[101]]## ## Call:## lm(formula = lifeExp ~ year1950, data = x)## ## Coefficients:## (Intercept) year1950 ## 43.2922 0.5277 ## ## ## [[102]]## ## Call:## lm(formula = lifeExp ~ year1950, data = x)## ## Coefficients:## (Intercept) year1950 ## 48.5634 0.4205 ## ## ## [[103]]## ## Call:## lm(formula = lifeExp ~ year1950, data = x)## ## Coefficients:## (Intercept) year1950 ## 64.3885 0.1962 ## ## ## [[104]]## ## Call:## lm(formula = lifeExp ~ year1950, data = x)## ## Coefficients:## (Intercept) year1950 ## 60.4724 0.3372 ## ## ## [[105]]## ## Call:## lm(formula = lifeExp ~ year1950, data = x)## ## Coefficients:## (Intercept) year1950 ## 66.5274 0.2106 ## ## ## [[106]]## ## Call:## lm(formula = lifeExp ~ year1950, data = x)## ## Coefficients:## (Intercept) year1950 ## 53.0778 0.4599 ## ## ## [[107]]## ## Call:## lm(formula = lifeExp ~ year1950, data = x)## ## Coefficients:## (Intercept) year1950 ## 63.6473 0.1574 ## ## ## [[108]]## ## Call:## lm(formula = lifeExp ~ year1950, data = x)## ## Coefficients:## (Intercept) year1950 ## 42.83361 -0.04583 ## ## ## [[109]]## ## Call:## lm(formula = lifeExp ~ year1950, data = x)## ## Coefficients:## (Intercept) year1950 ## 47.8462 0.3407 ## ## ## [[110]]## ## Call:## lm(formula = lifeExp ~ year1950, data = x)## ## Coefficients:## (Intercept) year1950 ## 39.5149 0.6496 ## ## ## [[111]]## ## Call:## lm(formula = lifeExp ~ year1950, data = x)## ## Coefficients:## (Intercept) year1950 ## 35.7373 0.5047 ## ## ## [[112]]## ## Call:## lm(formula = lifeExp ~ year1950, data = x)## ## Coefficients:## (Intercept) year1950 ## 61.0240 0.2552 ## ## ## [[113]]## ## Call:## lm(formula = lifeExp ~ year1950, data = x)## ## Coefficients:## (Intercept) year1950 ## 30.455 0.214 ## ## ## [[114]]## ## Call:## lm(formula = lifeExp ~ year1950, data = x)## ## Coefficients:## (Intercept) year1950 ## 61.1641 0.3409 ## ## ## [[115]]## ## Call:## lm(formula = lifeExp ~ year1950, data = x)## ## Coefficients:## (Intercept) year1950 ## 66.742 0.134 ## ## ## [[116]]## ## Call:## lm(formula = lifeExp ~ year1950, data = x)## ## Coefficients:## (Intercept) year1950 ## 65.6853 0.2005 ## ## ## [[117]]## ## Call:## lm(formula = lifeExp ~ year1950, data = x)## ## Coefficients:## (Intercept) year1950 ## 34.2163 0.2296 ## ## ## [[118]]## ## Call:## lm(formula = lifeExp ~ year1950, data = x)## ## Coefficients:## (Intercept) year1950 ## 49.0030 0.1692 ## ## ## [[119]]## ## Call:## lm(formula = lifeExp ~ year1950, data = x)## ## Coefficients:## (Intercept) year1950 ## 65.9160 0.2809 ## ## ## [[120]]## ## Call:## lm(formula = lifeExp ~ year1950, data = x)## ## Coefficients:## (Intercept) year1950 ## 59.3017 0.2449 ## ## ## [[121]]## ## Call:## lm(formula = lifeExp ~ year1950, data = x)## ## Coefficients:## (Intercept) year1950 ## 37.1086 0.3828 ## ## ## [[122]]## ## Call:## lm(formula = lifeExp ~ year1950, data = x)## ## Coefficients:## (Intercept) year1950 ## 46.19771 0.09507 ## ## ## [[123]]## ## Call:## lm(formula = lifeExp ~ year1950, data = x)## ## Coefficients:## (Intercept) year1950 ## 71.2725 0.1663 ## ## ## [[124]]## ## Call:## lm(formula = lifeExp ~ year1950, data = x)## ## Coefficients:## (Intercept) year1950 ## 69.0093 0.2222 ## ## ## [[125]]## ## Call:## lm(formula = lifeExp ~ year1950, data = x)## ## Coefficients:## (Intercept) year1950 ## 44.9926 0.5544 ## ## ## [[126]]## ## Call:## lm(formula = lifeExp ~ year1950, data = x)## ## Coefficients:## (Intercept) year1950 ## 60.6829 0.3272 ## ## ## [[127]]## ## Call:## lm(formula = lifeExp ~ year1950, data = x)## ## Coefficients:## (Intercept) year1950 ## 42.7590 0.1747 ## ## ## [[128]]## ## Call:## lm(formula = lifeExp ~ year1950, data = x)## ## Coefficients:## (Intercept) year1950 ## 51.962 0.347 ## ## ## [[129]]## ## Call:## lm(formula = lifeExp ~ year1950, data = x)## ## Coefficients:## (Intercept) year1950 ## 40.2123 0.3826 ## ## ## [[130]]## ## Call:## lm(formula = lifeExp ~ year1950, data = x)## ## Coefficients:## (Intercept) year1950 ## 61.7050 0.1737 ## ## ## [[131]]## ## Call:## lm(formula = lifeExp ~ year1950, data = x)## ## Coefficients:## (Intercept) year1950 ## 43.3796 0.5878 ## ## ## [[132]]## ## Call:## lm(formula = lifeExp ~ year1950, data = x)## ## Coefficients:## (Intercept) year1950 ## 45.0278 0.4972 ## ## ## [[133]]## ## Call:## lm(formula = lifeExp ~ year1950, data = x)## ## Coefficients:## (Intercept) year1950 ## 44.0320 0.1216 ## ## ## [[134]]## ## Call:## lm(formula = lifeExp ~ year1950, data = x)## ## Coefficients:## (Intercept) year1950 ## 68.437 0.186 ## ## ## [[135]]## ## Call:## lm(formula = lifeExp ~ year1950, data = x)## ## Coefficients:## (Intercept) year1950 ## 68.0455 0.1842 ## ## ## [[136]]## ## Call:## lm(formula = lifeExp ~ year1950, data = x)## ## Coefficients:## (Intercept) year1950 ## 65.3751 0.1833 ## ## ## [[137]]## ## Call:## lm(formula = lifeExp ~ year1950, data = x)## ## Coefficients:## (Intercept) year1950 ## 56.8539 0.3297 ## ## ## [[138]]## ## Call:## lm(formula = lifeExp ~ year1950, data = x)## ## Coefficients:## (Intercept) year1950 ## 37.6668 0.6716 ## ## ## [[139]]## ## Call:## lm(formula = lifeExp ~ year1950, data = x)## ## Coefficients:## (Intercept) year1950 ## 42.5962 0.6011 ## ## ## [[140]]## ## Call:## lm(formula = lifeExp ~ year1950, data = x)## ## Coefficients:## (Intercept) year1950 ## 28.9194 0.6055 ## ## ## [[141]]## ## Call:## lm(formula = lifeExp ~ year1950, data = x)## ## Coefficients:## (Intercept) year1950 ## 47.77888 -0.06043 ## ## ## [[142]]## ## Call:## lm(formula = lifeExp ~ year1950, data = x)## ## Coefficients:## (Intercept) year1950 ## 55.40729 -0.09302Map inside the data?
country_model <- by_country %>% mutate(model = map(data, function(x){ lm(lifeExp ~ year1950, data = x) }) )country_model## # A tibble: 142 x 4## country continent data model ## <fct> <fct> <list> <list>## 1 Afghanistan Asia <tibble [12 × 2]> <lm> ## 2 Albania Europe <tibble [12 × 2]> <lm> ## 3 Algeria Africa <tibble [12 × 2]> <lm> ## 4 Angola Africa <tibble [12 × 2]> <lm> ## 5 Argentina Americas <tibble [12 × 2]> <lm> ## 6 Australia Oceania <tibble [12 × 2]> <lm> ## 7 Austria Europe <tibble [12 × 2]> <lm> ## 8 Bahrain Asia <tibble [12 × 2]> <lm> ## 9 Bangladesh Asia <tibble [12 × 2]> <lm> ## 10 Belgium Europe <tibble [12 × 2]> <lm> ## # … with 132 more rowsA case for map (shorthand function)
country_model <- by_country %>% mutate(model = map(data, ~lm(lifeExp ~ year1950, data = .)))country_model## # A tibble: 142 x 4## country continent data model ## <fct> <fct> <list> <list>## 1 Afghanistan Asia <tibble [12 × 2]> <lm> ## 2 Albania Europe <tibble [12 × 2]> <lm> ## 3 Algeria Africa <tibble [12 × 2]> <lm> ## 4 Angola Africa <tibble [12 × 2]> <lm> ## 5 Argentina Americas <tibble [12 × 2]> <lm> ## 6 Australia Oceania <tibble [12 × 2]> <lm> ## 7 Austria Europe <tibble [12 × 2]> <lm> ## 8 Bahrain Asia <tibble [12 × 2]> <lm> ## 9 Bangladesh Asia <tibble [12 × 2]> <lm> ## 10 Belgium Europe <tibble [12 × 2]> <lm> ## # … with 132 more rowswhere's the model?
country_model$model[[1]]## ## Call:## lm(formula = lifeExp ~ year1950, data = .)## ## Coefficients:## (Intercept) year1950 ## 29.3566 0.2753we need to summarise this content?
tidy(country_model$model[[1]])## # A tibble: 2 x 5## term estimate std.error statistic p.value## <chr> <dbl> <dbl> <dbl> <dbl>## 1 (Intercept) 29.4 0.699 42.0 1.40e-12## 2 year1950 0.275 0.0205 13.5 9.84e- 8So should we repeat it for each one?
tidy(country_model$model[[1]])## # A tibble: 2 x 5## term estimate std.error statistic p.value## <chr> <dbl> <dbl> <dbl> <dbl>## 1 (Intercept) 29.4 0.699 42.0 1.40e-12## 2 year1950 0.275 0.0205 13.5 9.84e- 8tidy(country_model$model[[2]])## # A tibble: 2 x 5## term estimate std.error statistic p.value## <chr> <dbl> <dbl> <dbl> <dbl>## 1 (Intercept) 58.6 1.13 51.7 1.79e-13## 2 year1950 0.335 0.0332 10.1 1.46e- 6tidy(country_model$model[[3]])## # A tibble: 2 x 5## term estimate std.error statistic p.value## <chr> <dbl> <dbl> <dbl> <dbl>## 1 (Intercept) 42.2 0.756 55.8 8.22e-14## 2 year1950 0.569 0.0221 25.7 1.81e-10NO NICK, THERE's A BETTER WAY.
country_model %>% mutate(tidy = map(model, tidy))## # A tibble: 142 x 5## country continent data model tidy ## <fct> <fct> <list> <list> <list> ## 1 Afghanistan Asia <tibble [12 × 2]> <lm> <tibble [2 × 5]>## 2 Albania Europe <tibble [12 × 2]> <lm> <tibble [2 × 5]>## 3 Algeria Africa <tibble [12 × 2]> <lm> <tibble [2 × 5]>## 4 Angola Africa <tibble [12 × 2]> <lm> <tibble [2 × 5]>## 5 Argentina Americas <tibble [12 × 2]> <lm> <tibble [2 × 5]>## 6 Australia Oceania <tibble [12 × 2]> <lm> <tibble [2 × 5]>## 7 Austria Europe <tibble [12 × 2]> <lm> <tibble [2 × 5]>## 8 Bahrain Asia <tibble [12 × 2]> <lm> <tibble [2 × 5]>## 9 Bangladesh Asia <tibble [12 × 2]> <lm> <tibble [2 × 5]>## 10 Belgium Europe <tibble [12 × 2]> <lm> <tibble [2 × 5]>## # … with 132 more rowscountry_coefs <- country_model %>% mutate(tidy = map(model, tidy)) %>% unnest(tidy) %>% select(country, continent, term, estimate)country_coefs## # A tibble: 284 x 4## country continent term estimate## <fct> <fct> <chr> <dbl>## 1 Afghanistan Asia (Intercept) 29.4 ## 2 Afghanistan Asia year1950 0.275## 3 Albania Europe (Intercept) 58.6 ## 4 Albania Europe year1950 0.335## 5 Algeria Africa (Intercept) 42.2 ## 6 Algeria Africa year1950 0.569## 7 Angola Africa (Intercept) 31.7 ## 8 Angola Africa year1950 0.209## 9 Argentina Americas (Intercept) 62.2 ## 10 Argentina Americas year1950 0.232## # … with 274 more rowstidy_country_coefs <- country_coefs %>% spread(key = term, value = estimate) %>% rename(intercept = `(Intercept)`)tidy_country_coefs## # A tibble: 142 x 4## country continent intercept year1950## <fct> <fct> <dbl> <dbl>## 1 Afghanistan Asia 29.4 0.275## 2 Albania Europe 58.6 0.335## 3 Algeria Africa 42.2 0.569## 4 Angola Africa 31.7 0.209## 5 Argentina Americas 62.2 0.232## 6 Australia Oceania 67.9 0.228## 7 Austria Europe 66.0 0.242## 8 Bahrain Asia 51.8 0.468## 9 Bangladesh Asia 35.1 0.498## 10 Belgium Europe 67.5 0.209## # … with 132 more rowstidy_country_coefs %>% filter(country == "Australia")## # A tibble: 1 x 4## country continent intercept year1950## <fct> <fct> <dbl> <dbl>## 1 Australia Oceania 67.9 0.228Your turn: Five minute challenge
- Fit the models to all countries
- Pick your favourite country (not Australia), print the coefficients, and make a hand sketch of the the model fit.
Plot all the models
country_aug <- country_model %>% mutate(augmented = map(model, augment)) %>% unnest(augmented)country_aug## # A tibble: 1,704 x 11## country continent lifeExp year1950 .fitted .se.fit .resid .hat .sigma .cooksd## <fct> <fct> <dbl> <dbl> <dbl> <dbl> <dbl> <dbl> <dbl> <dbl>## 1 Afghan… Asia 28.8 2 29.9 0.664 -1.11 0.295 1.21 2.43e-1## 2 Afghan… Asia 30.3 7 31.3 0.580 -0.952 0.225 1.24 1.13e-1## 3 Afghan… Asia 32.0 12 32.7 0.503 -0.664 0.169 1.27 3.60e-2## 4 Afghan… Asia 34.0 17 34.0 0.436 -0.0172 0.127 1.29 1.65e-5## 5 Afghan… Asia 36.1 22 35.4 0.385 0.674 0.0991 1.27 1.85e-2## 6 Afghan… Asia 38.4 27 36.8 0.357 1.65 0.0851 1.15 9.23e-2## 7 Afghan… Asia 39.9 32 38.2 0.357 1.69 0.0851 1.15 9.67e-2## 8 Afghan… Asia 40.8 37 39.5 0.385 1.28 0.0991 1.21 6.67e-2## 9 Afghan… Asia 41.7 42 40.9 0.436 0.754 0.127 1.26 3.17e-2## 10 Afghan… Asia 41.8 47 42.3 0.503 -0.534 0.169 1.27 2.33e-2## # … with 1,694 more rows, and 1 more variable: .std.resid <dbl>p1 <- gapminder %>% ggplot(aes(year, lifeExp, group = country)) + geom_line(alpha = 1/3) + ggtitle("Data")p2 <- ggplot(country_aug) + geom_line(aes(x = year1950 + 1950, y = .fitted, group = country), alpha = 1/3) + xlab("year") + ggtitle("Fitted models")grid.arrange(p1, p2, ncol=2)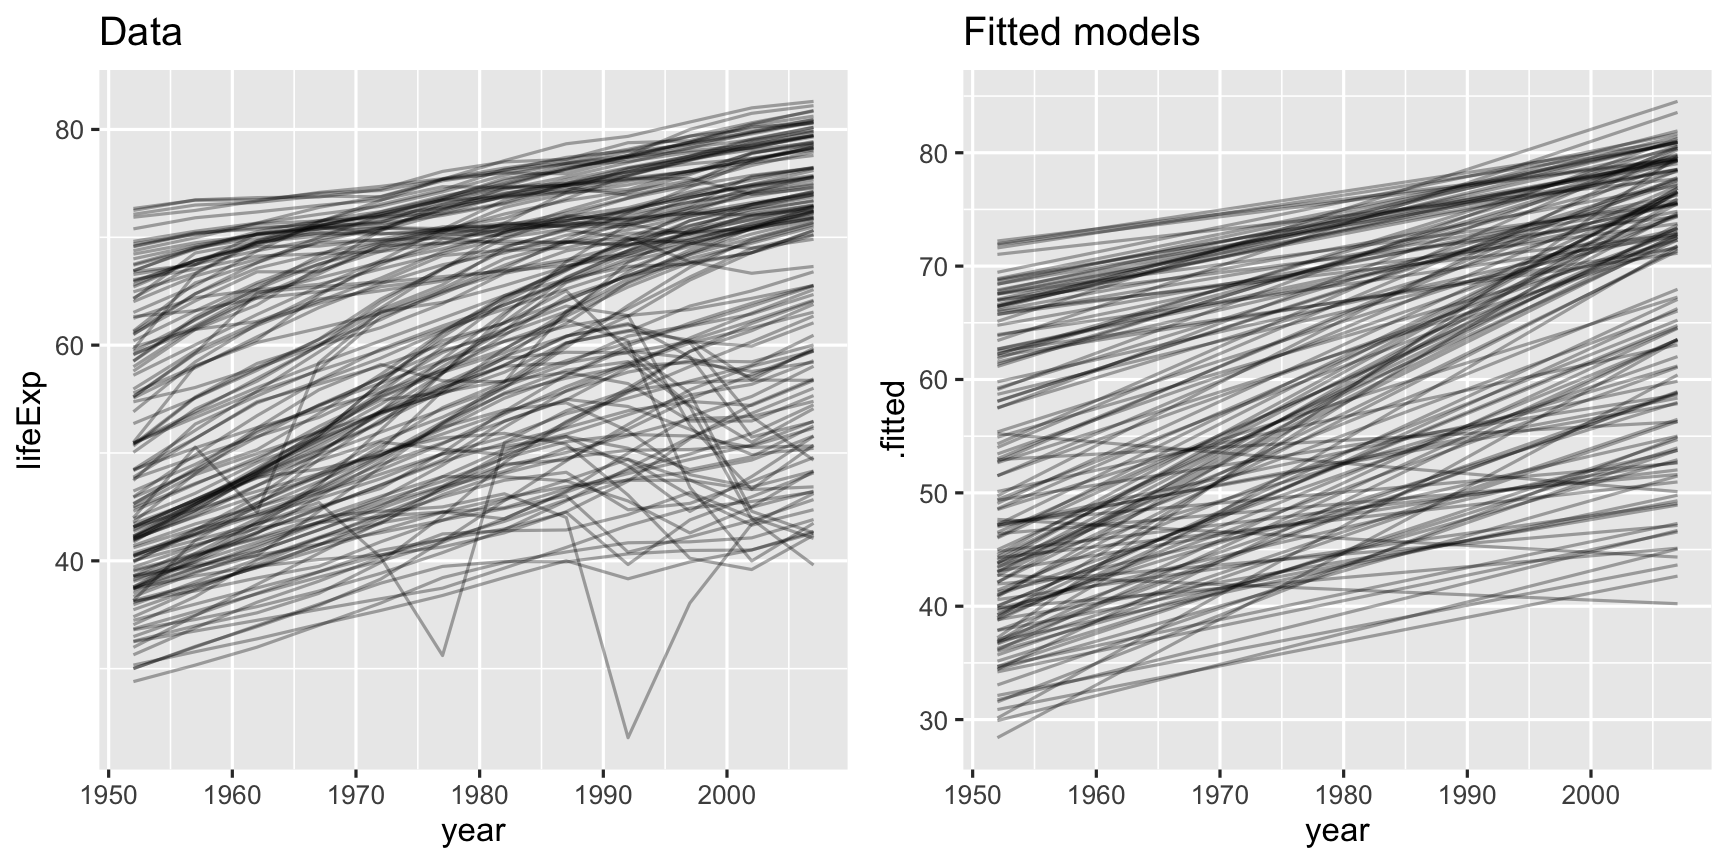
Plot all the model coefficients
p <- ggplot(tidy_country_coefs, aes(x = intercept, y = year1950, colour = continent, label = country)) + geom_point(alpha = 0.5, size = 2) + scale_color_brewer(palette = "Dark2")Let's summarise the information learned from the model coefficients.
- Generally the relationship is negative: this means that if a country started with a high intercept tends to have lower rate of increase.
- There is a difference across the continents: Countries in Europe and Oceania tended to start with higher life expectancy and increased; countries in Asia and America tended to start lower but have high rates of improvement; Africa tends to start lower and have a huge range in rate of change.
- Three countries had negative growth in life expectancy: Rwand, Zimbabwe, Zambia
Model diagnostics by country
country_glance <- country_model %>% mutate(glance = map(model, glance)) %>% unnest(glance)country_glance## # A tibble: 142 x 15## country continent data model r.squared adj.r.squared sigma statistic p.value df## <fct> <fct> <lis> <lis> <dbl> <dbl> <dbl> <dbl> <dbl> <int>## 1 Afghan… Asia <tib… <lm> 0.948 0.942 1.22 181. 9.84e- 8 2## 2 Albania Europe <tib… <lm> 0.911 0.902 1.98 102. 1.46e- 6 2## 3 Algeria Africa <tib… <lm> 0.985 0.984 1.32 662. 1.81e-10 2## 4 Angola Africa <tib… <lm> 0.888 0.877 1.41 79.1 4.59e- 6 2## 5 Argent… Americas <tib… <lm> 0.996 0.995 0.292 2246. 4.22e-13 2## 6 Austra… Oceania <tib… <lm> 0.980 0.978 0.621 481. 8.67e-10 2## 7 Austria Europe <tib… <lm> 0.992 0.991 0.407 1261. 7.44e-12 2## 8 Bahrain Asia <tib… <lm> 0.967 0.963 1.64 291. 1.02e- 8 2## 9 Bangla… Asia <tib… <lm> 0.989 0.988 0.977 930. 3.37e-11 2## 10 Belgium Europe <tib… <lm> 0.995 0.994 0.293 1822. 1.20e-12 2## # … with 132 more rows, and 5 more variables: logLik <dbl>, AIC <dbl>, BIC <dbl>,## # deviance <dbl>, df.residual <int>Plot the R2 values as a histogram.
ggplot(country_glance, aes(x = r.squared)) + geom_histogram()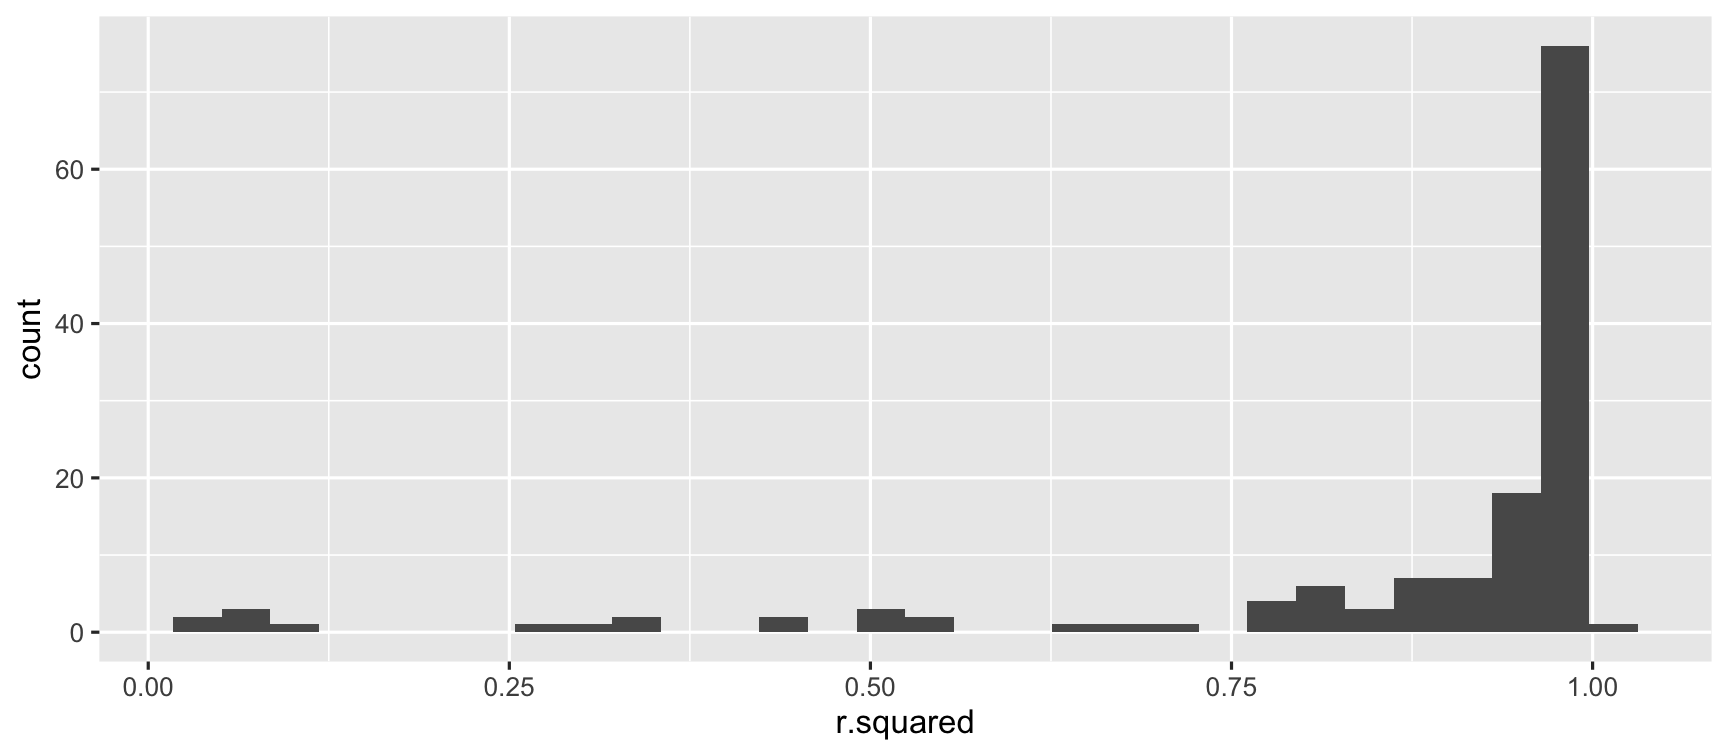
Countries with worst fit
Examine the countries with the worst fit, countries with R2<0.45, by making scatterplots of the data, with the linear model overlaid.
badfit <- country_glance %>% filter(r.squared <= 0.45)gap_bad <- gap %>% filter(country %in% badfit$country)gg_bad_fit <-ggplot(data = gap_bad, aes(x = year, y = lifeExp)) + geom_point() + facet_wrap(~country) + scale_x_continuous(breaks = seq(1950,2000,10), labels = c("1950", "60","70", "80","90","2000")) + geom_smooth(method = "lm", se = FALSE)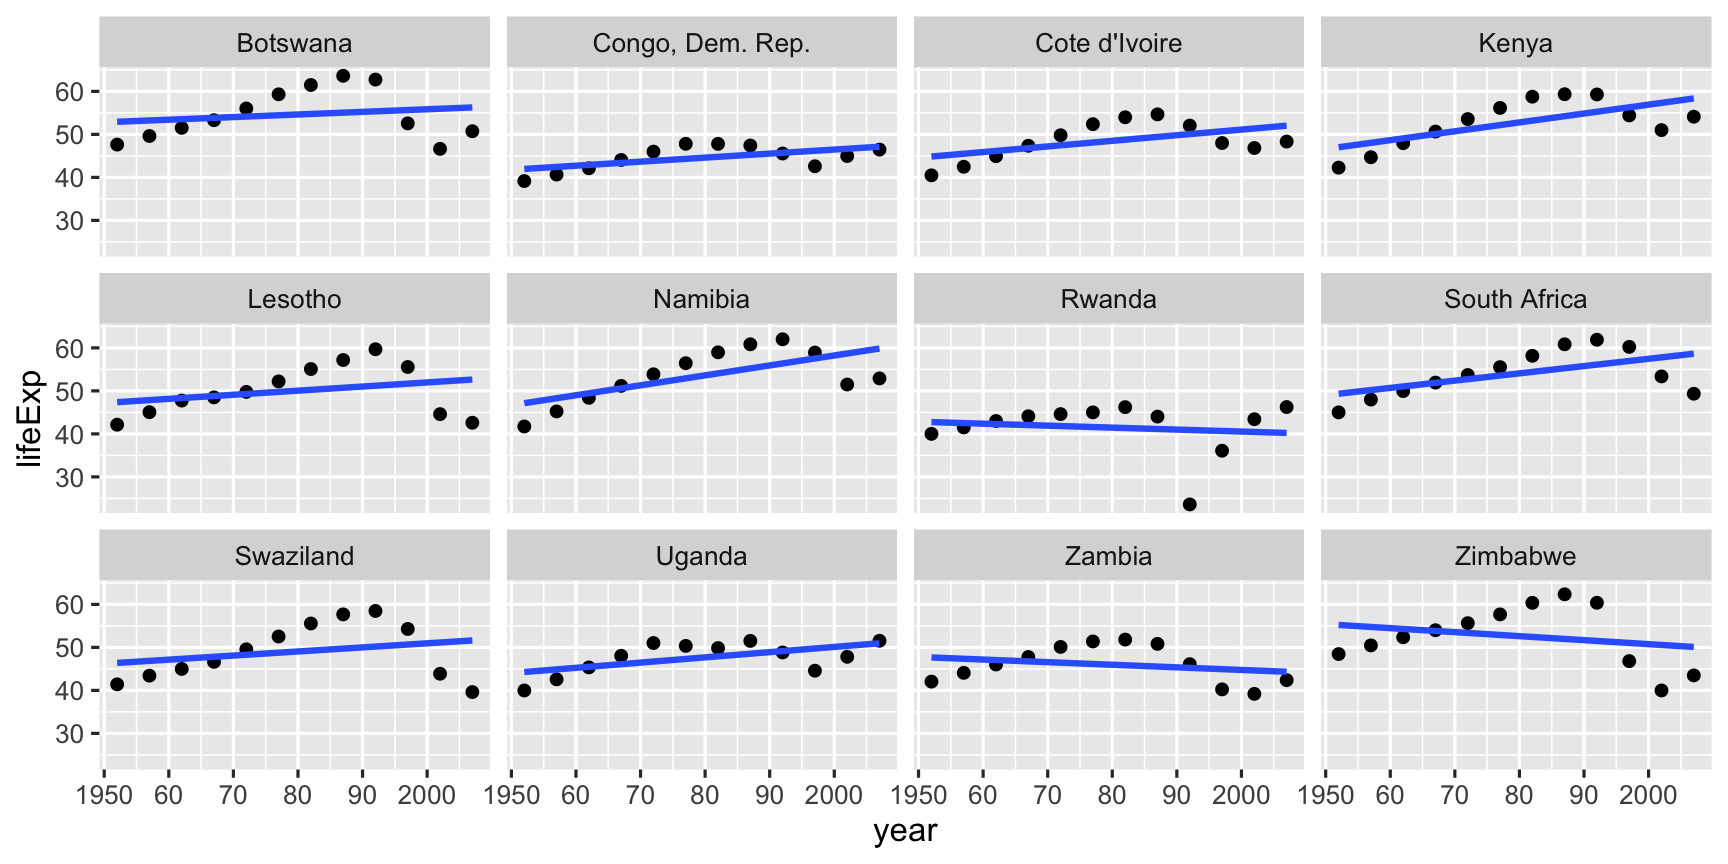
Each of these countries had been moving on a nice trajectory of increasing life expectancy, and then suffered a big dip during the time period.
Your Turn:
- Use google to explain these dips using world history and current affairs information.
- finish the lab exercise (with new data)
- once you are done, you can collect mid semester exam
- remember the project deadline: Find team members, and potential topics to study (List of groups will be posted here)
Share and share alike

This work is licensed under a Creative Commons Attribution 4.0 International License.
many models
- gapminder
- fit with year
- recenter year to be from 1950
- fit again (ask a quiz question about this)
- What is the average life expectancy?
- What if we want to fit a separate model for each country? Can we fit a linear model for each country?
- why are making day0
- why are we standardization
Open the app available at https://ebsmonash.shinyapps.io/SSregression/. (The original version was obtained from https://github.com/paternogbc/SSregression, developed by Gustavo Brant Paterno, a PhD student from Brazil.)
The app simulates some data using different slopes and error variance. It allows you to see how characteristics of the data affect model summaries. Time to play!
- Vary the slope from high positive to zero. What happens to the error variance? The total variance and the regression variance (due to model)? Does the proportion of variation of each component change? How? Is this the same if you vary from large negative slope to zero?
- Holding the slope fixed at 1, increase the standard deviation of the error model. What happens to components of variation?
- As the slope changes, what happens to the intercept?
- Why isn't the estimated slope the same as what is set by the slider?