ETC1010: Data Modelling and Computing
Lecture 7A: Linear Models
Dr. Nicholas Tierney & Professor Di Cook
EBS, Monash U.
2019-09-11
Recap
- style
- functions
- map
Today: The language of models
Modelling
Use models to explain the relationship between variables and to make predictions
For now we focus on linear models (but remember there are other types of models too!)
Packages


You're familiar with the tidyverse:
The broom package takes the messy output of built-in functions in R, such as
lm, and turns them into tidy data frames.
Data: Paris Paintings
Paris Paintings
pp <- read_csv("data/paris-paintings.csv", na = c("n/a", "", "NA"))pp## # A tibble: 3,393 x 61## name sale lot position dealer year origin_author origin_cat school_pntg## <chr> <chr> <chr> <dbl> <chr> <dbl> <chr> <chr> <chr> ## 1 L176… L1764 2 0.0328 L 1764 F O F ## 2 L176… L1764 3 0.0492 L 1764 I O I ## 3 L176… L1764 4 0.0656 L 1764 X O D/FL ## 4 L176… L1764 5 0.0820 L 1764 F O F ## 5 L176… L1764 5 0.0820 L 1764 F O F ## 6 L176… L1764 6 0.0984 L 1764 X O I ## 7 L176… L1764 7 0.115 L 1764 F O F ## 8 L176… L1764 7 0.115 L 1764 F O F ## 9 L176… L1764 8 0.131 L 1764 X O I ## 10 L176… L1764 9 0.148 L 1764 D/FL O D/FL ## # … with 3,383 more rows, and 52 more variables: diff_origin <dbl>, logprice <dbl>,## # price <dbl>, count <dbl>, subject <chr>, authorstandard <chr>, artistliving <dbl>,## # authorstyle <chr>, author <chr>, winningbidder <chr>, winningbiddertype <chr>,## # endbuyer <chr>, Interm <dbl>, type_intermed <chr>, Height_in <dbl>, Width_in <dbl>,## # Surface_Rect <dbl>, Diam_in <dbl>, Surface_Rnd <dbl>, Shape <chr>, Surface <dbl>,## # material <chr>, mat <chr>, materialCat <chr>, quantity <dbl>, nfigures <dbl>,## # engraved <dbl>, original <dbl>, prevcoll <dbl>, othartist <dbl>, paired <dbl>,## # figures <dbl>, finished <dbl>, lrgfont <dbl>, relig <dbl>, landsALL <dbl>,## # lands_sc <dbl>, lands_elem <dbl>, lands_figs <dbl>, lands_ment <dbl>, arch <dbl>,## # mytho <dbl>, peasant <dbl>, othgenre <dbl>, singlefig <dbl>, portrait <dbl>,## # still_life <dbl>, discauth <dbl>, history <dbl>, allegory <dbl>, pastorale <dbl>,## # other <dbl>Meet the data curators


Sandra van Ginhoven
Hilary Coe Cronheim
PhD students in the Duke Art, Law, and Markets Initiative in 2013
- Source: Printed catalogues of 28 auction sales in Paris, 1764- 1780
- 3,393 paintings, their prices, and descriptive details from sales catalogues over 60 variables
Auctions today
Auctions back in the day
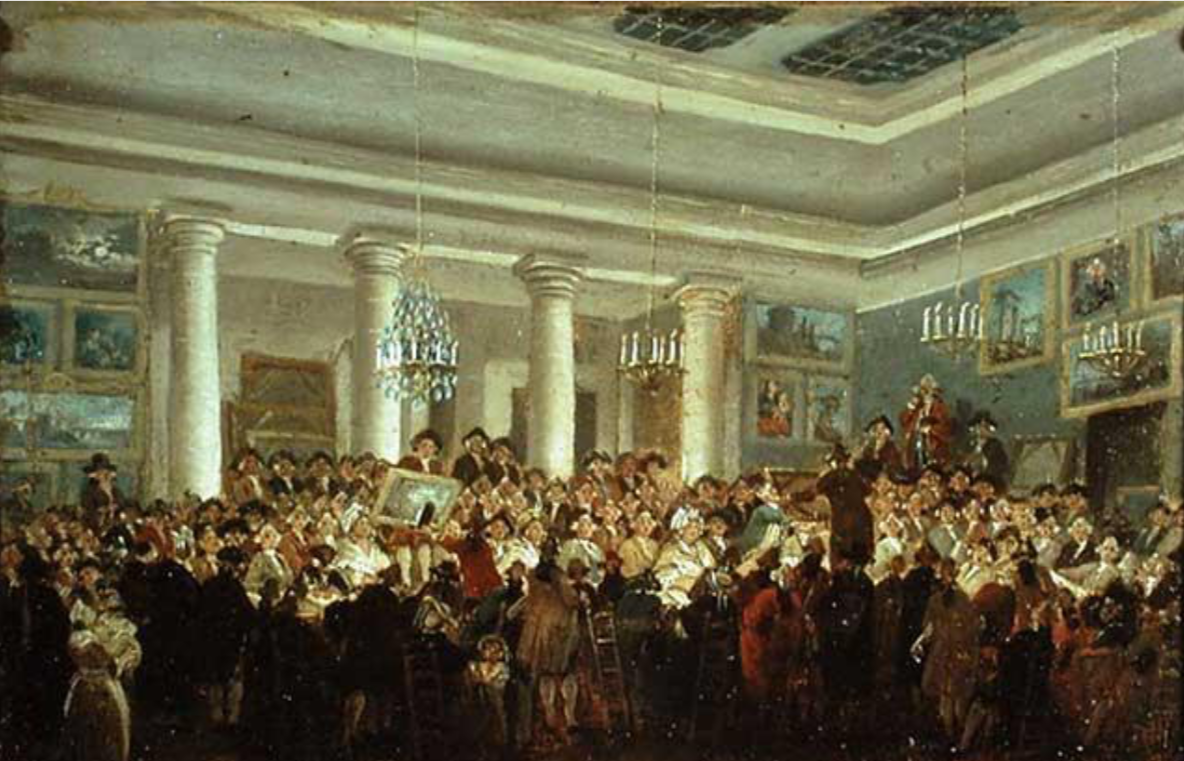
Pierre-Antoine de Machy, Public Sale at the Hôtel Bullion, Musée Carnavalet, Paris (18th century)
Paris auction market
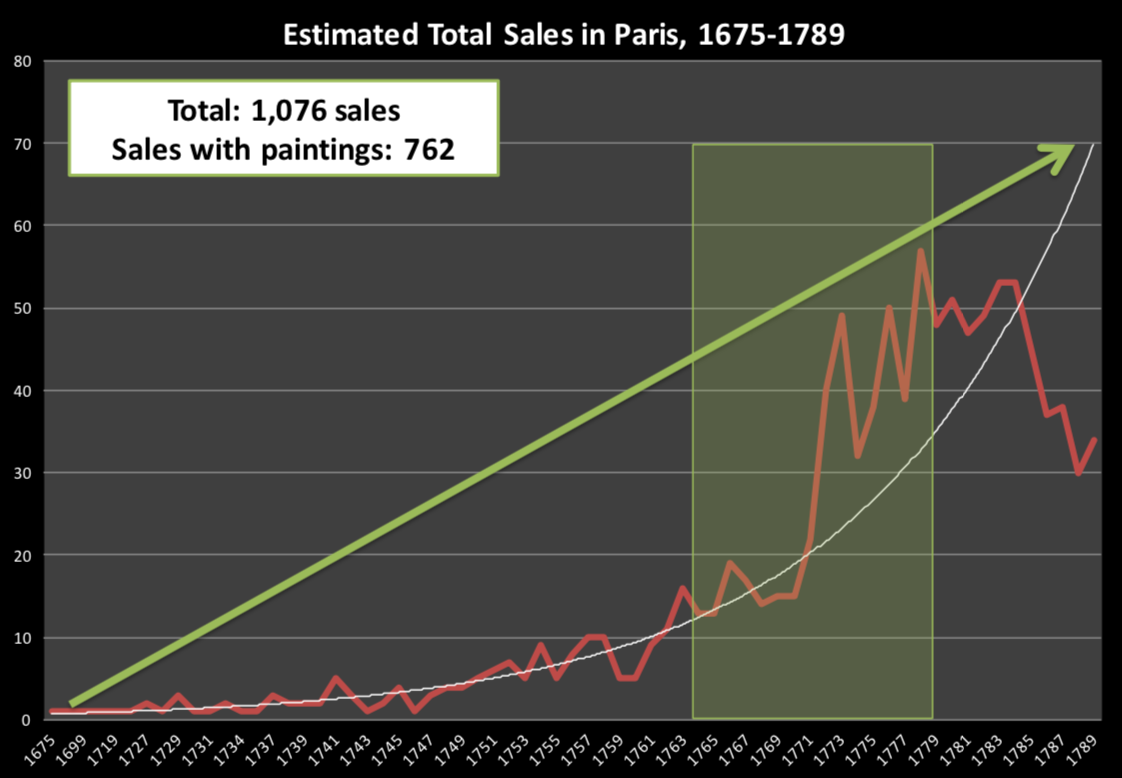
Modelling the relationship between variables
Prices: Describe the distribution of prices of paintings.
ggplot(data = pp, aes(x = price)) + geom_histogram(binwidth = 1000)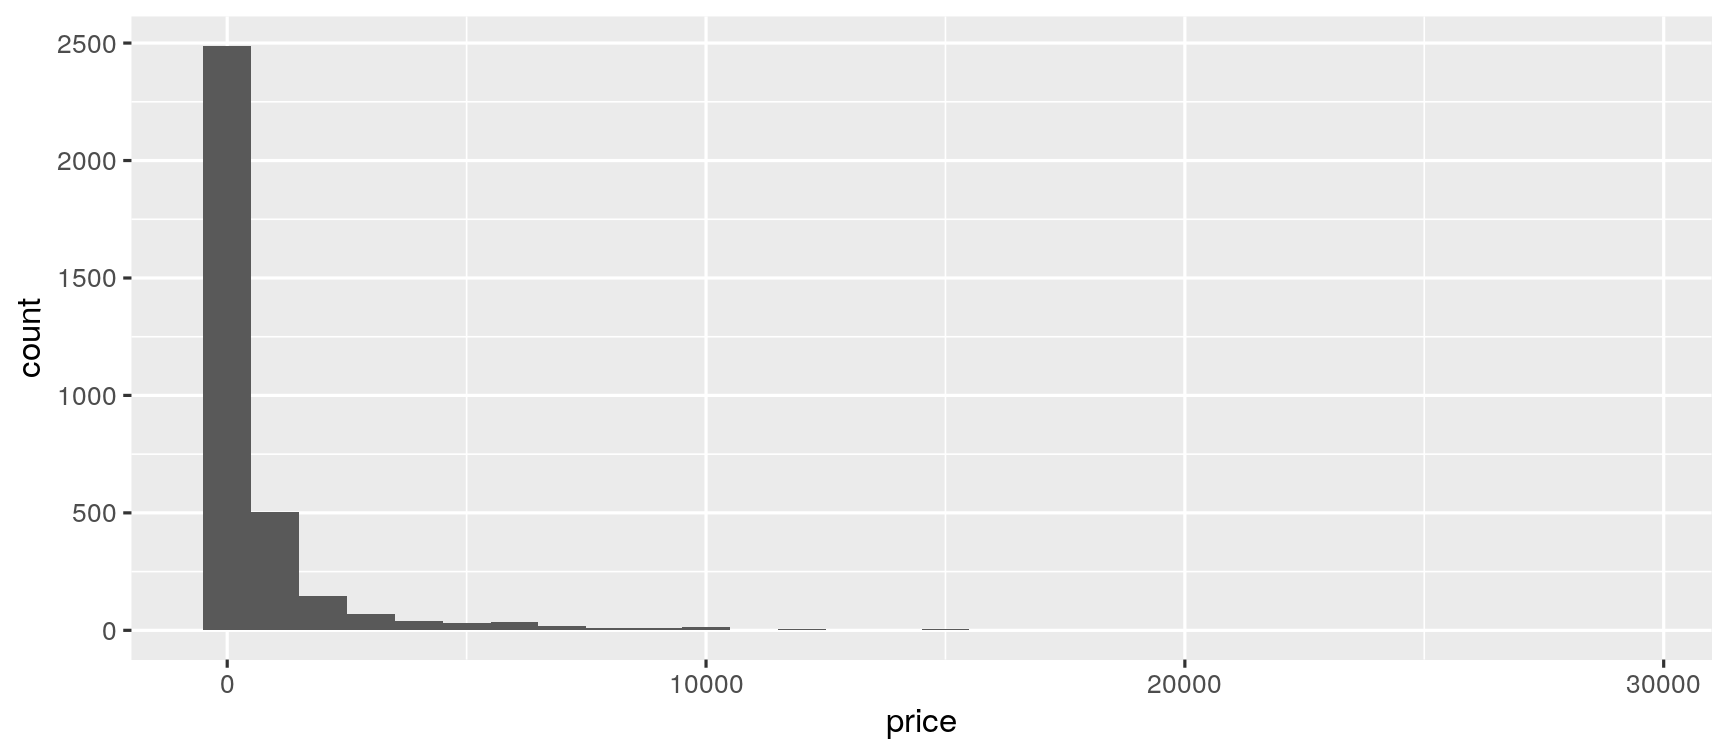
Models as functions
We can represent relationships between variables using functions
A function is a mathematical concept: the relationship between an output and one or more inputs.
Plug in the inputs and receive back the output
Models as functions: Example
- The formula y=3x+7 is a function with input x and output y, when x is 5, the output y is 22
y = 3 * 5 + 7 = 22
Models as functions: Example
- The formula y=3x+7 is a function with input x and output y, when x is 5, the output y is 22
y = 3 * 5 + 7 = 22
anon <- function(x) 3*x + 7anon(5)## [1] 22Height as a function of width
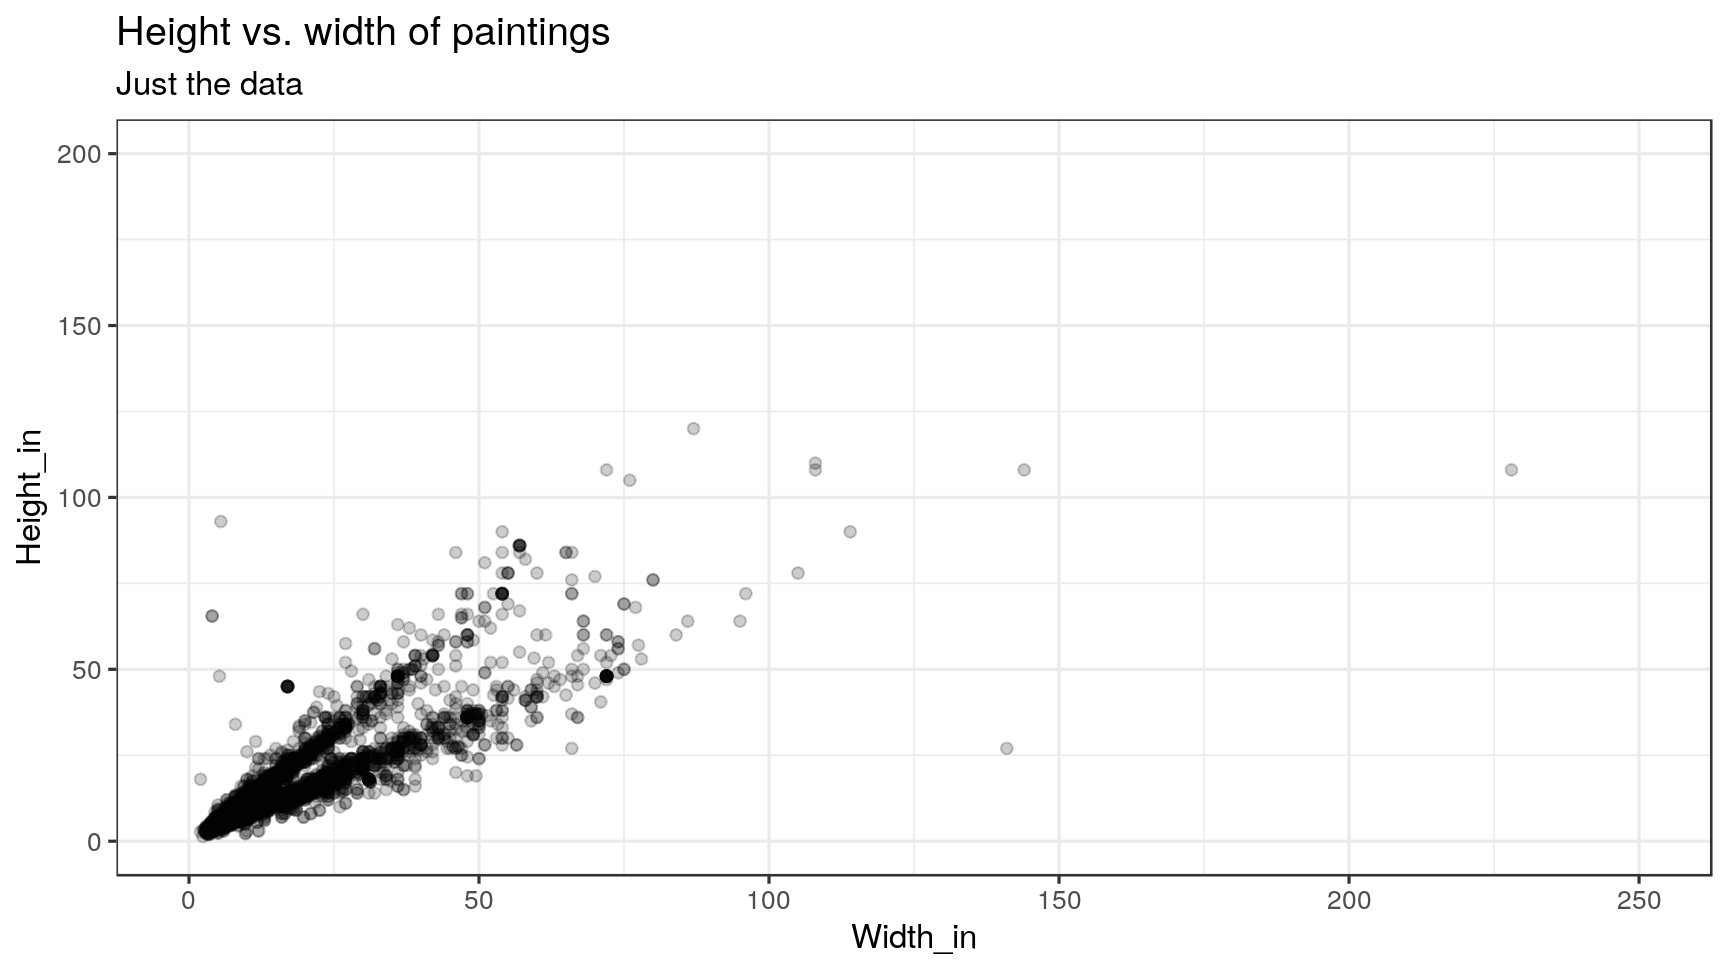
Describe the relationship between height and width of paintings.
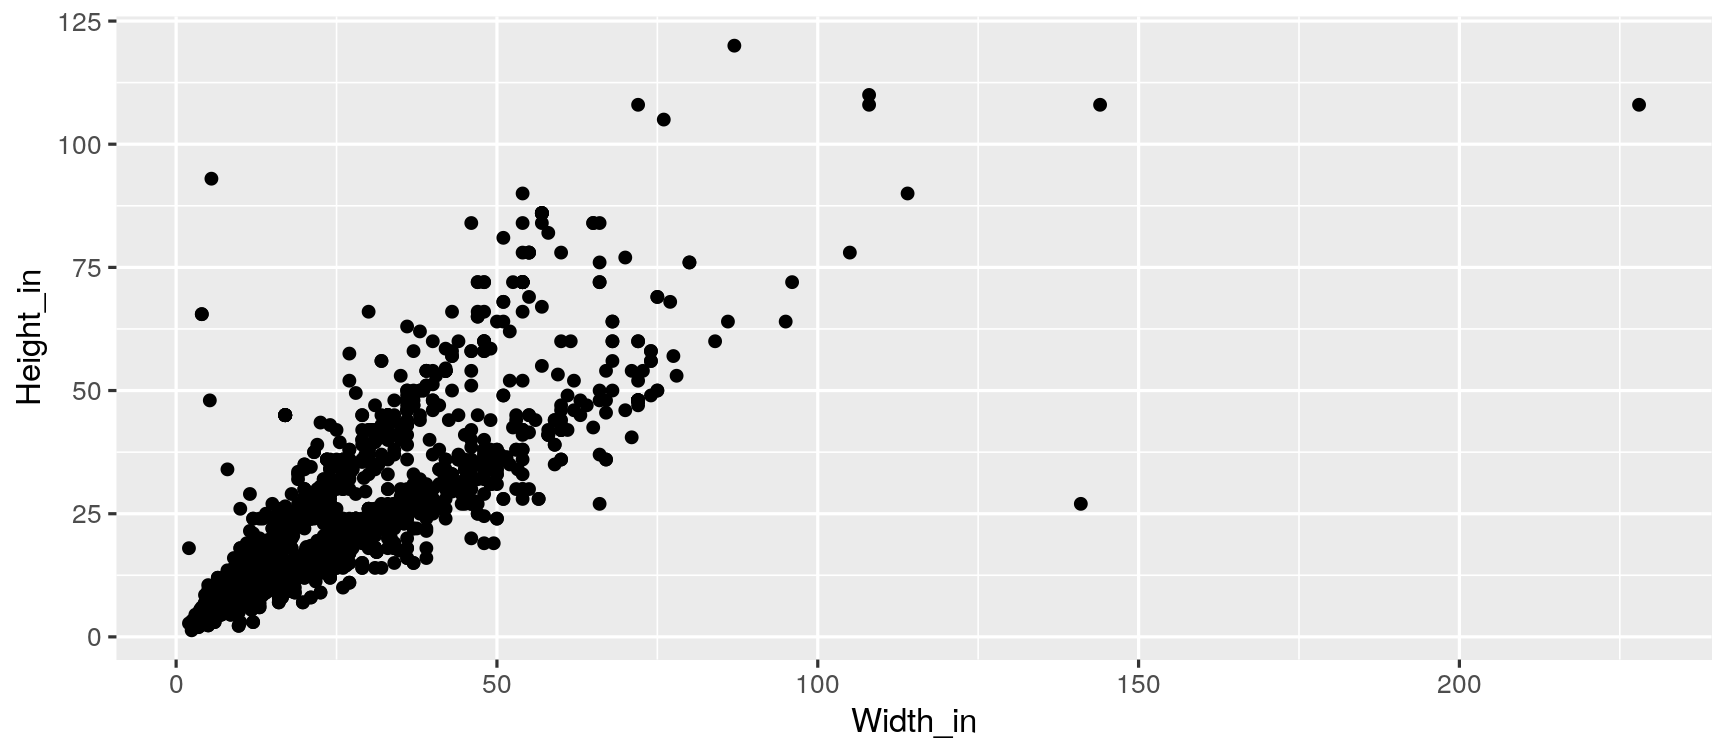
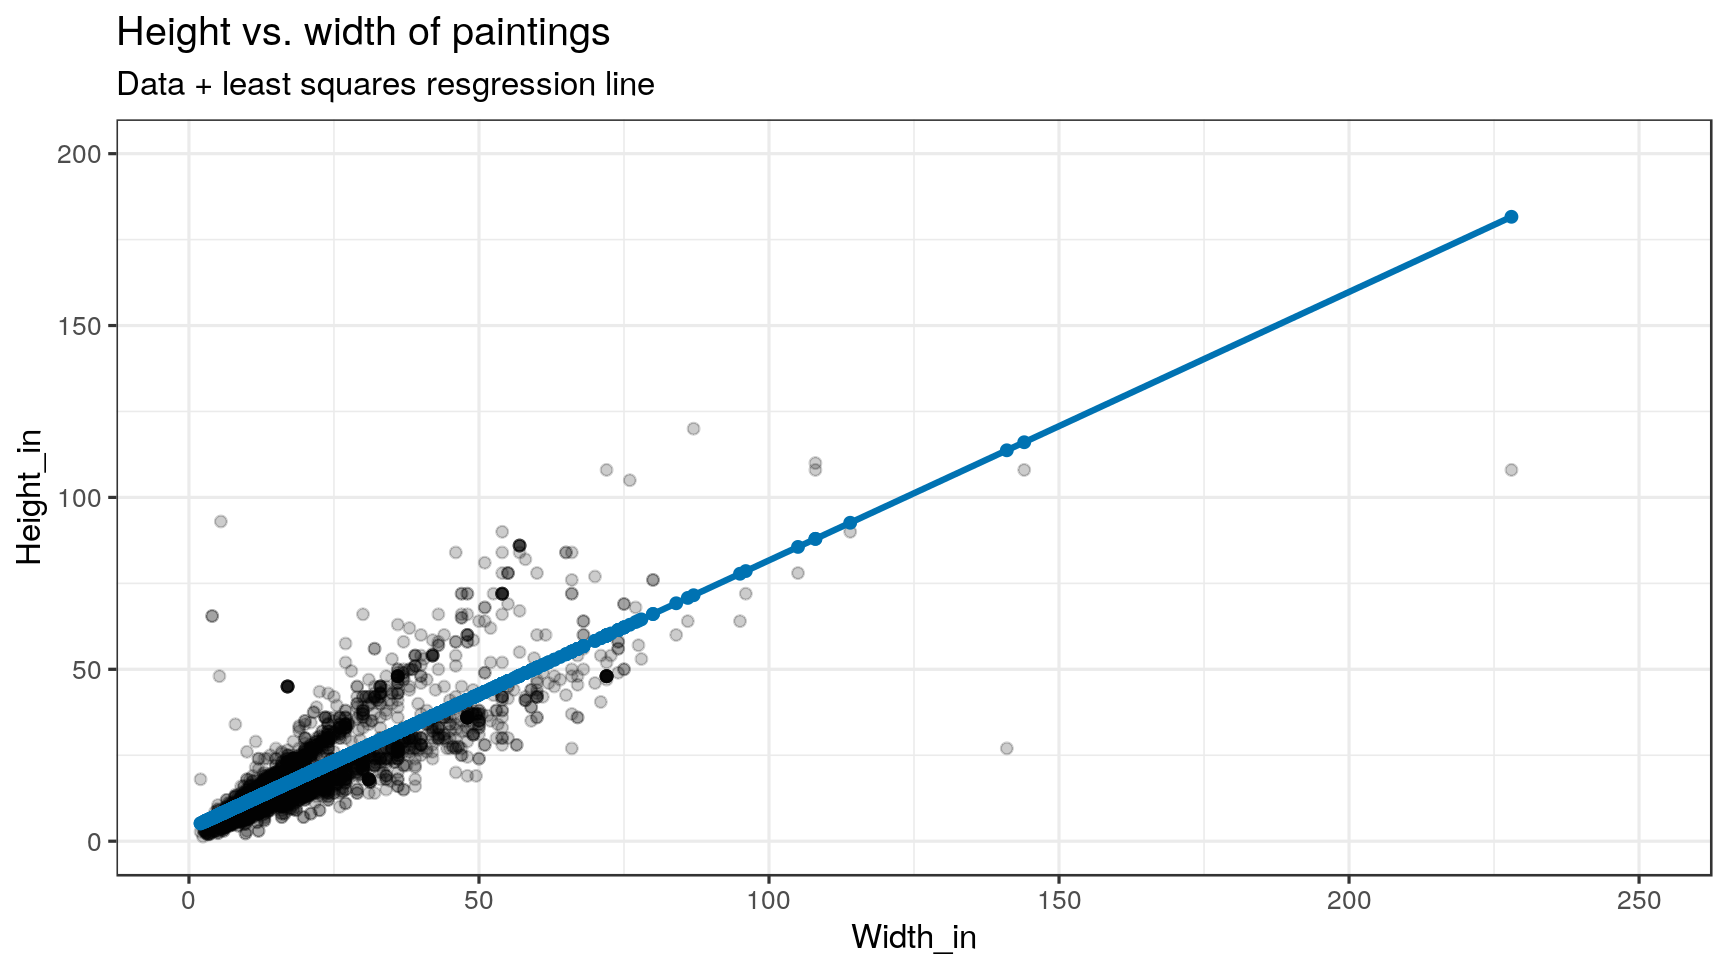
Visualizing the linear model
ggplot(data = pp, aes(x = Width_in, y = Height_in)) + geom_point() + geom_smooth(method = "lm") # lm for linear model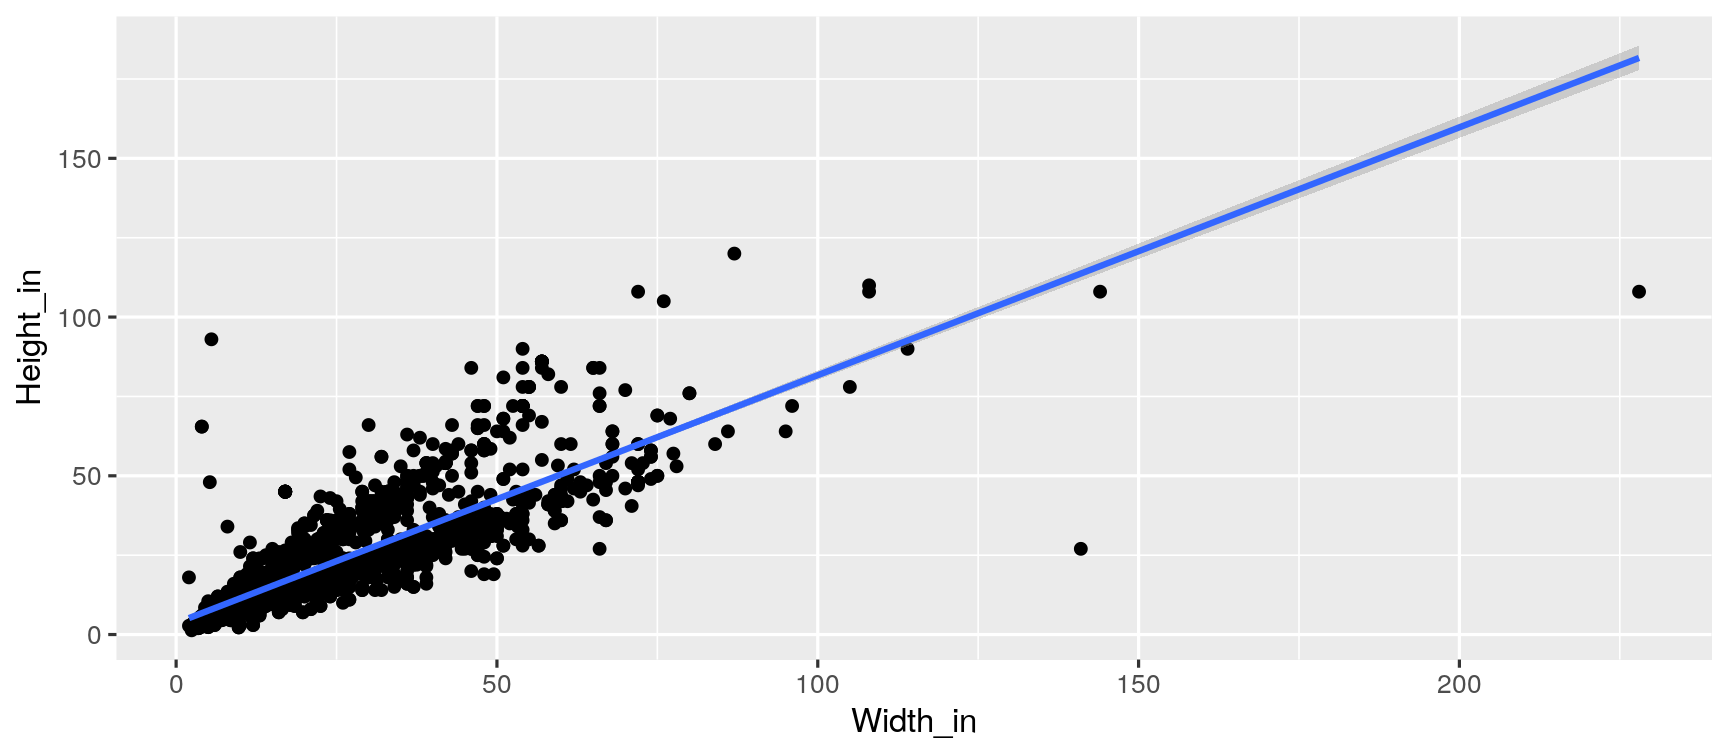
Visualizing the linear model (without the measure of uncertainty around the line)
ggplot(data = pp, aes(x = Width_in, y = Height_in)) + geom_point() + geom_smooth(method = "lm", se = FALSE) # lm for linear model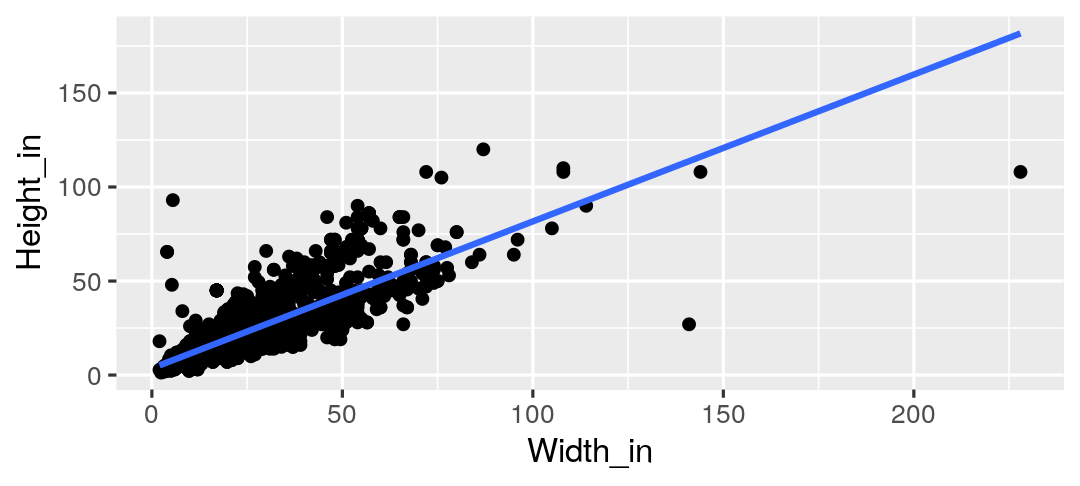
Visualizing the linear model (style the line)
ggplot(data = pp, aes(x = Width_in, y = Height_in)) + geom_point() + geom_smooth(method = "lm", se = FALSE, col = "pink", # color lty = 2, # line type lwd = 3) # line weight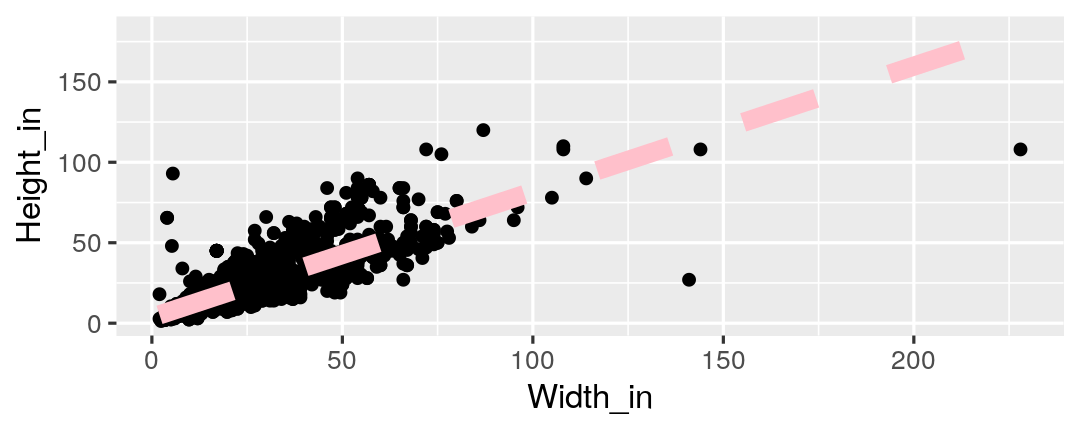
Vocabulary
- Response variable: Variable whose behavior or variation you are trying to understand, on the y-axis (dependent variable)
Vocabulary
- Response variable: Variable whose behavior or variation you are trying to understand, on the y-axis (dependent variable)
- Explanatory variables: Other variables that you want to use to explain the variation in the response, on the x-axis (independent variables)
Vocabulary
- Predicted value: Output of the function model function
- The model function gives the typical value of the response variable conditioning on the explanatory variables
Vocabulary
- Predicted value: Output of the function model function
- The model function gives the typical value of the response variable conditioning on the explanatory variables
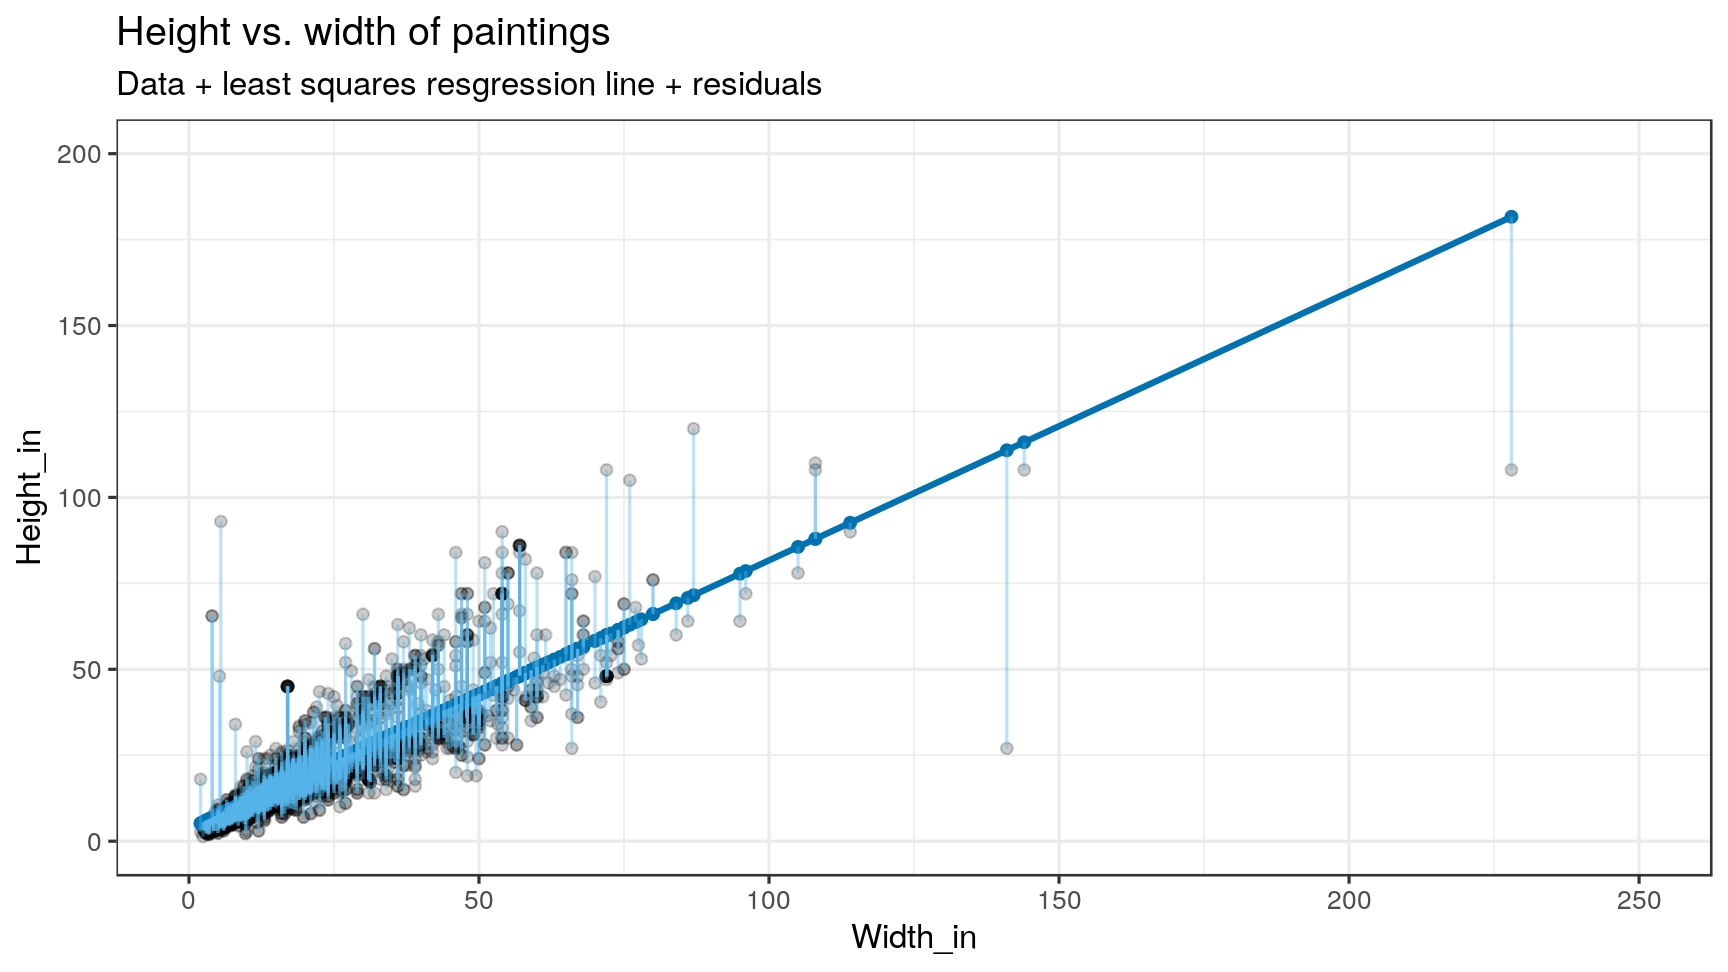
- Residuals: Show how far each case is from its model value
- Residual = Observed value - Predicted value
- Tells how far above/below the model function each case is
Residuals
- What does a negative residual mean?
- Which paintings on the plot have have negative residuals, those below or above the line?

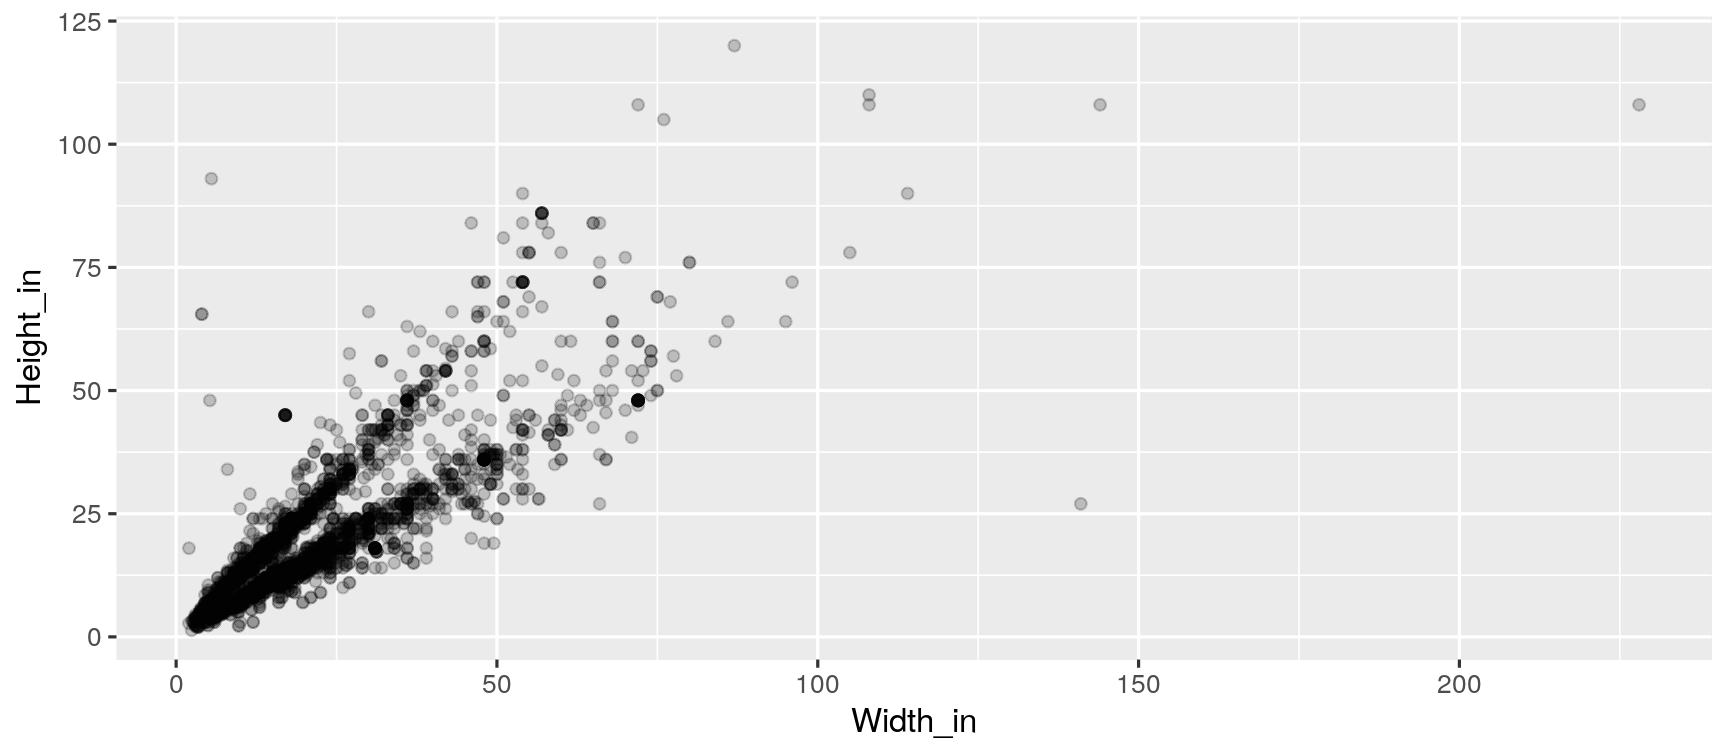

What feature is apparent in this plot that was not (as) apparent in the previous plots?
What might be the reason for this feature?
The plot below displays the relationship between height and width of paintings. It uses a lower alpha level for the points than the previous plots we looked at.
Landscape vs portait paintings
Landscape painting is the depiction in art of landscapes – natural scenery such as mountains, valleys, trees, rivers, and forests, especially where the main subject is a wide view – with its elements arranged into a coherent composition.1
Landscape paintings tend to be wider than longer.
Portrait painting is a genre in painting, where the intent is to depict a human subject.2
Portrait paintings tend to be longer than wider.
[1] Source: Wikipedia, Landscape painting
[2] Source: Wikipedia, Portait painting
Multiple explanatory variables
How, if at all, the relatonship between width and height of paintings vary by whether or not they have any landscape elements?
ggplot(data = pp, aes(x = Width_in, y = Height_in, color = factor(landsALL))) + geom_point(alpha = 0.4) + geom_smooth(method = "lm", se = FALSE) + labs(color = "landscape")
Models - upsides and downsides
Models can sometimes reveal patterns that are not evident in a graph of the data. This is a great advantage of modelling over simple visual inspection of data.
There is a real risk, however, that a model is imposing structure that is not really there on the scatter of data, just as people imagine animal shapes in the stars. A skeptical approach is always warranted.
Variation around the model...
is just as important as the model, if not more!
Statistics is the explanation of variation in the context of what remains unexplained.
Scatterplot suggests there might be other factors that account for large parts of painting-to-painting variability, or perhaps just that randomness plays a big role.
Adding more explanatory variables to a model can sometimes usefully reduce the size of the scatter around the model. (We'll talk more about this later.)
How do we use models?
Explanation: Characterize the relationship between y and x via slopes for numerical explanatory variables or differences for categorical explanatory variables. (also called inference, as you make inference on these relationships)
Prediction: Plug in x, get the predicted y
Your Turn: go to rstudio.cloud and start exercise 7a
Characterizing relationships with models
Height & width
m_ht_wt <- lm(Height_in ~ Width_in, data = pp)m_ht_wt## ## Call:## lm(formula = Height_in ~ Width_in, data = pp)## ## Coefficients:## (Intercept) Width_in ## 3.6214 0.7808Height & width
m_ht_wt <- lm(Height_in ~ Width_in, data = pp)m_ht_wt## ## Call:## lm(formula = Height_in ~ Width_in, data = pp)## ## Coefficients:## (Intercept) Width_in ## 3.6214 0.7808Model of height and width
ˆHeightin=3.62+0.78 Widthin
Model of height and width
ˆHeightin=3.62+0.78 Widthin
- Slope: For each additional inch the painting is wider, the height is expected to be higher, on average, by 0.78 inches.
Model of height and width
ˆHeightin=3.62+0.78 Widthin
- Slope: For each additional inch the painting is wider, the height is expected to be higher, on average, by 0.78 inches.
- Intercept: Paintings that are 0 inches wide are expected to be 3.62 inches high, on average.
The linear model with a single predictor
- Interested in β0 (population parameter for the intercept) and the β1 (population parameter for the slope) in the following model:
^y=β0+β1 x
Least squares regression
The regression line minimizes the sum of squared residuals.
Least squares regression
The regression line minimizes the sum of squared residuals.
If ei=y−^y,
then, the regression line minimizes ∑ni=1e2i.
Visualizing residuals
Visualizing residuals (cont.)
Visualizing residuals (cont.)
Properties of the least squares regression line
- The regression line goes through the center of mass point, the coordinates corresponding to average x and average y: (¯x,¯y):
^y=β0+β1x → β0=^y−β1x
- The slope has the same sign as the correlation coefficient:
β1=rsysx
Properties of the least squares regression line
The sum of the residuals is zero: n∑i=1ei=0
The residuals and x values are uncorrelated.
Height & landscape features
m_ht_lands <- lm(Height_in ~ factor(landsALL), data = pp)m_ht_lands## ## Call:## lm(formula = Height_in ~ factor(landsALL), data = pp)## ## Coefficients:## (Intercept) factor(landsALL)1 ## 22.680 -5.645Height & landscape features
m_ht_lands <- lm(Height_in ~ factor(landsALL), data = pp)m_ht_lands## ## Call:## lm(formula = Height_in ~ factor(landsALL), data = pp)## ## Coefficients:## (Intercept) factor(landsALL)1 ## 22.680 -5.645ˆHeightin=22.68−5.65 landsALL
Height & landscape features (cont.)
Slope: Paintings with landscape features are expected, on average, to be 5.65 inches shorter than paintings that without landscape features.
- Compares baseline level (
landsALL = 0) to other level (landsALL = 1).
- Compares baseline level (
Intercept: Paintings that don't have landscape features are expected, on average, to be 22.68 inches tall.
Categorical predictor with 2 levels
## # A tibble: 8 x 3## name price landsALL## <chr> <dbl> <dbl>## 1 L1764-2 360 0## 2 L1764-3 6 0## 3 L1764-4 12 1## 4 L1764-5a 6 1## 5 L1764-5b 6 1## 6 L1764-6 9 0## 7 L1764-7a 12 0## 8 L1764-7b 12 0Relationship between height and school
(m_ht_sch <- lm(Height_in ~ school_pntg, data = pp))## ## Call:## lm(formula = Height_in ~ school_pntg, data = pp)## ## Coefficients:## (Intercept) school_pntgD/FL school_pntgF school_pntgG school_pntgI ## 14.000 2.329 10.197 1.650 10.287 ## school_pntgS school_pntgX ## 30.429 2.869Relationship between height and school
(m_ht_sch <- lm(Height_in ~ school_pntg, data = pp))## ## Call:## lm(formula = Height_in ~ school_pntg, data = pp)## ## Coefficients:## (Intercept) school_pntgD/FL school_pntgF school_pntgG school_pntgI ## 14.000 2.329 10.197 1.650 10.287 ## school_pntgS school_pntgX ## 30.429 2.869When the categorical explanatory variable has many levels, they're encoded to dummy variables.
Each coefficient describes the expected difference between heights in that particular school compared to the baseline level.
Categorical predictor with >2 levels
## # A tibble: 7 x 7## # Groups: school_pntg [7]## school_pntg D_FL F G I S X## <chr> <int> <int> <int> <int> <int> <int>## 1 A 0 0 0 0 0 0## 2 D/FL 1 0 0 0 0 0## 3 F 0 1 0 0 0 0## 4 G 0 0 1 0 0 0## 5 I 0 0 0 1 0 0## 6 S 0 0 0 0 1 0## 7 X 0 0 0 0 0 1The linear model with multiple predictors
- Population model:
^y=β0+β1 x1+β2 x2+⋯+βk xk
The linear model with multiple predictors
- Population model:
^y=β0+β1 x1+β2 x2+⋯+βk xk
- Sample model that we use to estimate the population model:
^y=b0+b1 x1+b2 x2+⋯+bk xk
Correlation does not imply causation!
- Remember this when interpreting model coefficients
Prediction with models
Predict height from width
On average, how tall are paintings that are 60 inches wide? ˆHeightin=3.62+0.78 Widthin
Predict height from width
On average, how tall are paintings that are 60 inches wide? ˆHeightin=3.62+0.78 Widthin
3.62 + 0.78 * 60## [1] 50.42"On average, we expect paintings that are 60 inches wide to be 50.42 inches high."
Warning: We "expect" this to happen, but there will be some variability. (We'll learn about measuring the variability around the prediction later.)
Prediction vs. extrapolation
On average, how tall are paintings that are 400 inches wide? ˆHeightin=3.62+0.78 Widthin

Watch out for extrapolation!
"When those blizzards hit the East Coast this winter, it proved to my satisfaction that global warming was a fraud. That snow was freezing cold. But in an alarming trend, temperatures this spring have risen. Consider this: On February 6th it was 10 degrees. Today it hit almost 80. At this rate, by August it will be 220 degrees. So clearly folks the climate debate rages on."1
Stephen Colbert, April 6th, 2010
[1] OpenIntro Statistics. "Extrapolation is treacherous." OpenIntro Statistics.
Measuring model fit
Measuring the strength of the fit
R2 is a common measurement of strength of linear model fit.
R2 tells us % variability in response explained by model.
Remaining variation is explained by variables not in the model.
R2 is sometimes called the coefficient of determination.
Obtaining R2 in R
- Height vs. width
glance(m_ht_wt)## # A tibble: 1 x 11## r.squared adj.r.squared sigma statistic p.value df logLik AIC BIC deviance## <dbl> <dbl> <dbl> <dbl> <dbl> <int> <dbl> <dbl> <dbl> <dbl>## 1 0.683 0.683 8.30 6749. 0 2 -11083. 22173. 22191. 216055.## # … with 1 more variable: df.residual <int>glance(m_ht_wt)$r.squared # extract R-squared## [1] 0.6829468Roughly 68% of the variability in heights of paintings can be explained by their widths.
Obtaining R2 in R
- Height vs. lanscape features
glance(m_ht_lands)$r.squared## [1] 0.03456724