ETC1010: Data Modelling and Computing
Lecture 4A: Relational data, and joins
Dr. Nicholas Tierney & Professor Di Cook
EBS, Monash U.
2019-08-21
1 / 35
While the song is playing...
Draw a mental model / concept map of last weeks lecture content
2 / 35
First - go to ED and mark another person's assignment
- dmac.netlify.com
3 / 35
Recap
- consultation hours
- ggplot
- tidy data
- drawing mental models
4 / 35
Recap: ggplot mental model
5 / 35
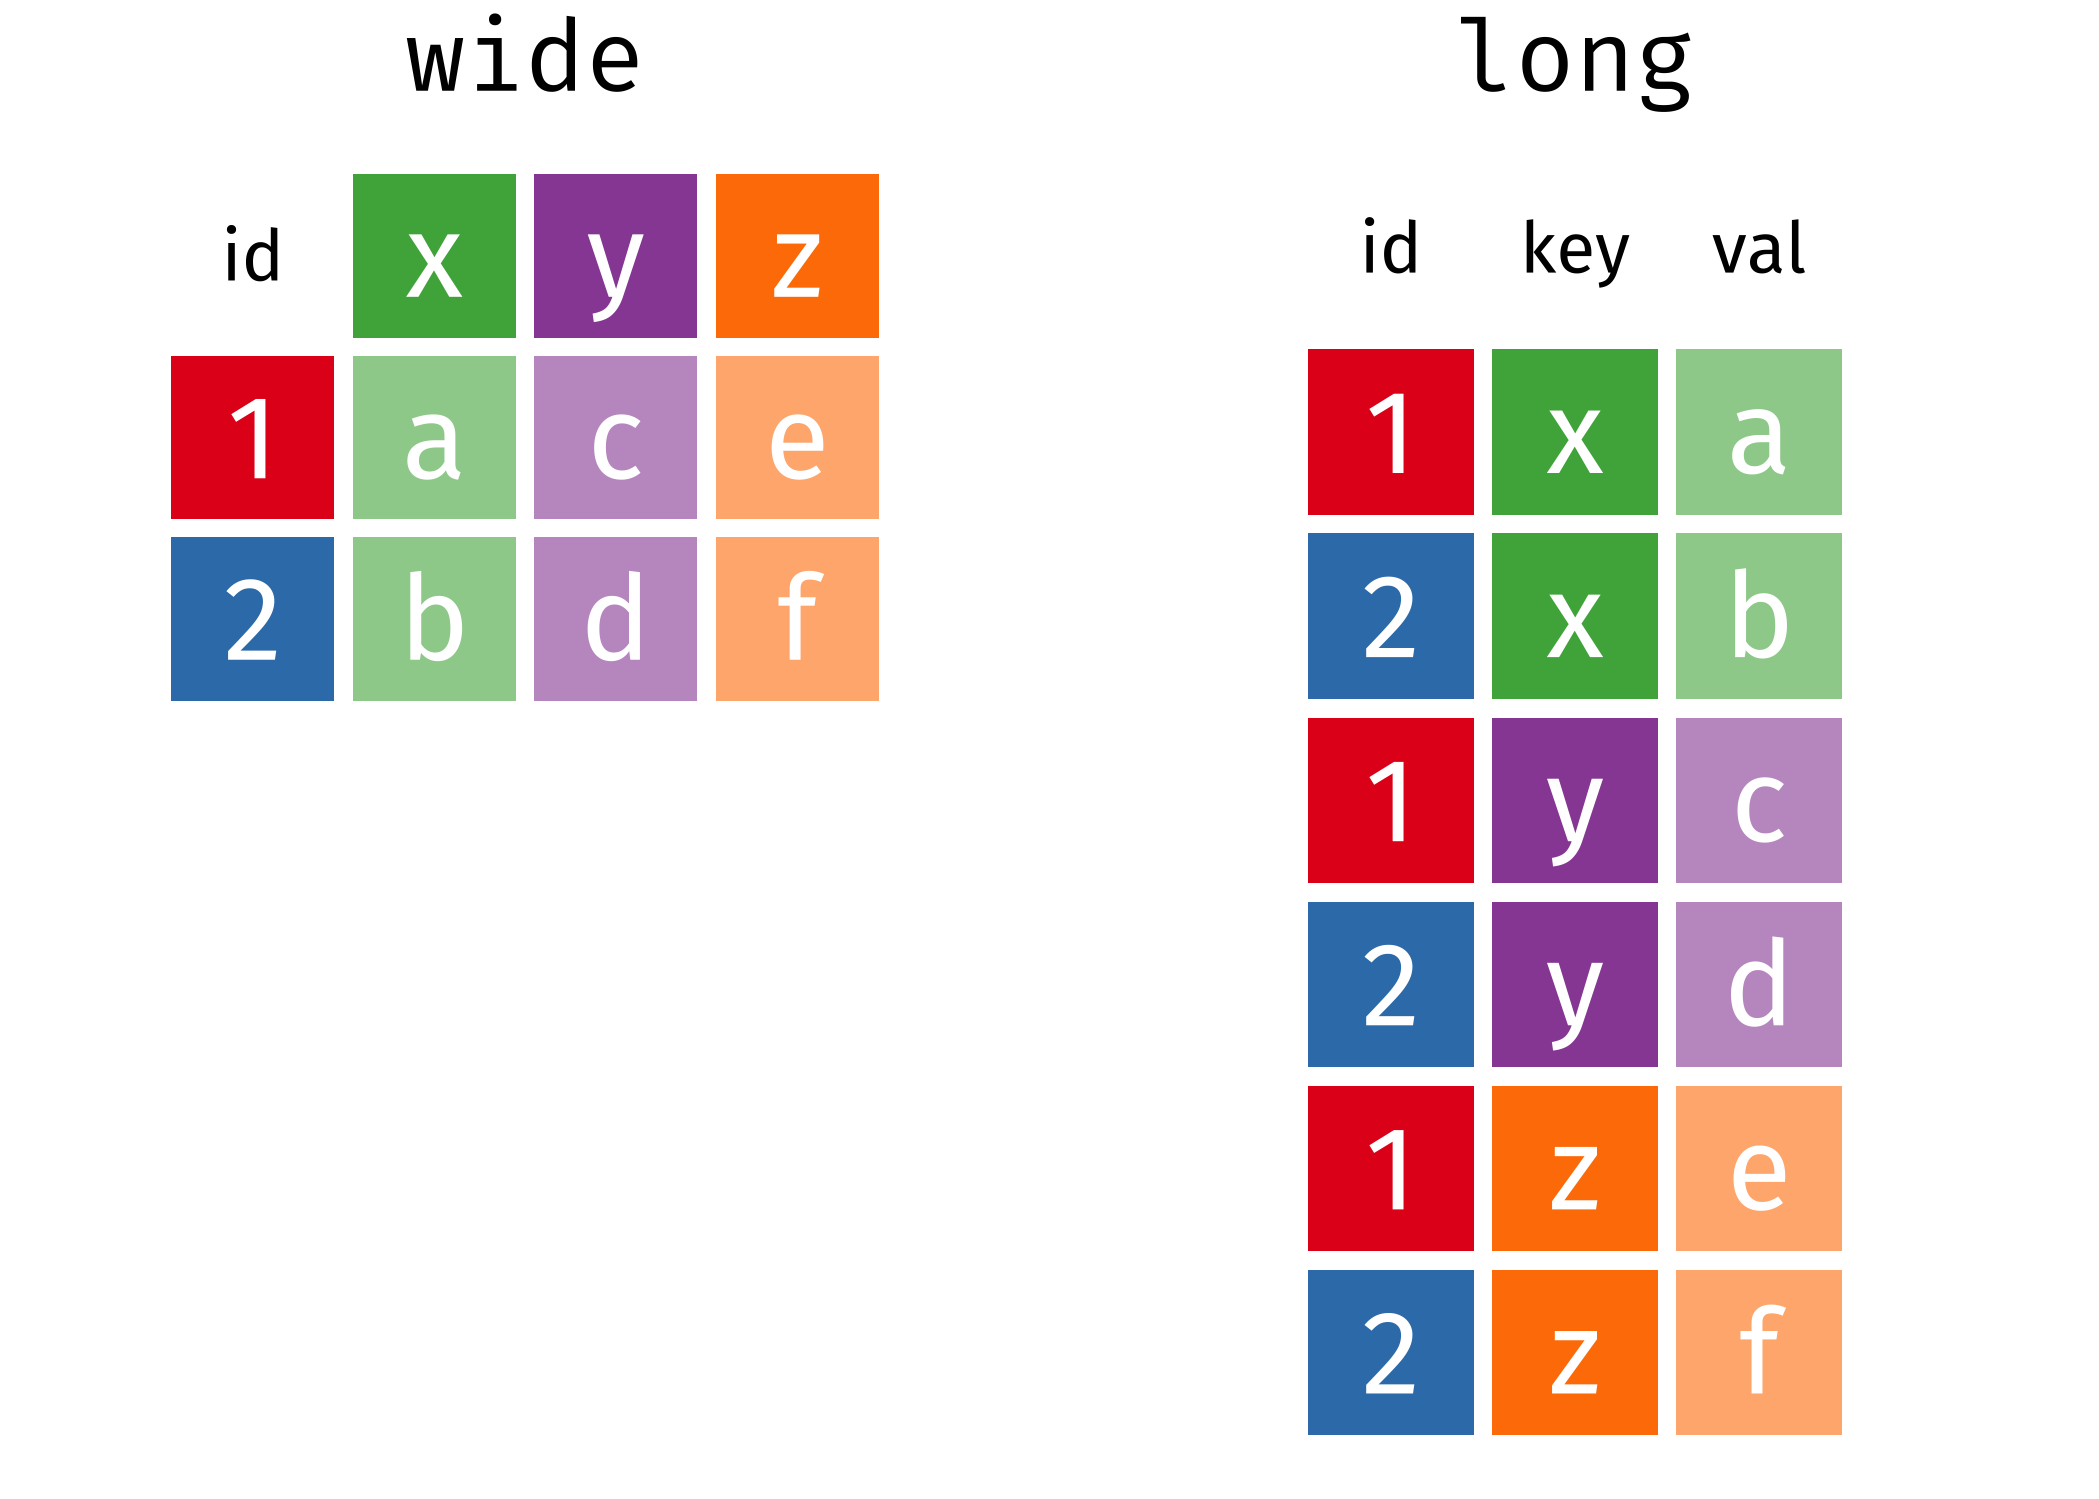
Recap: Tidy data
6 / 35
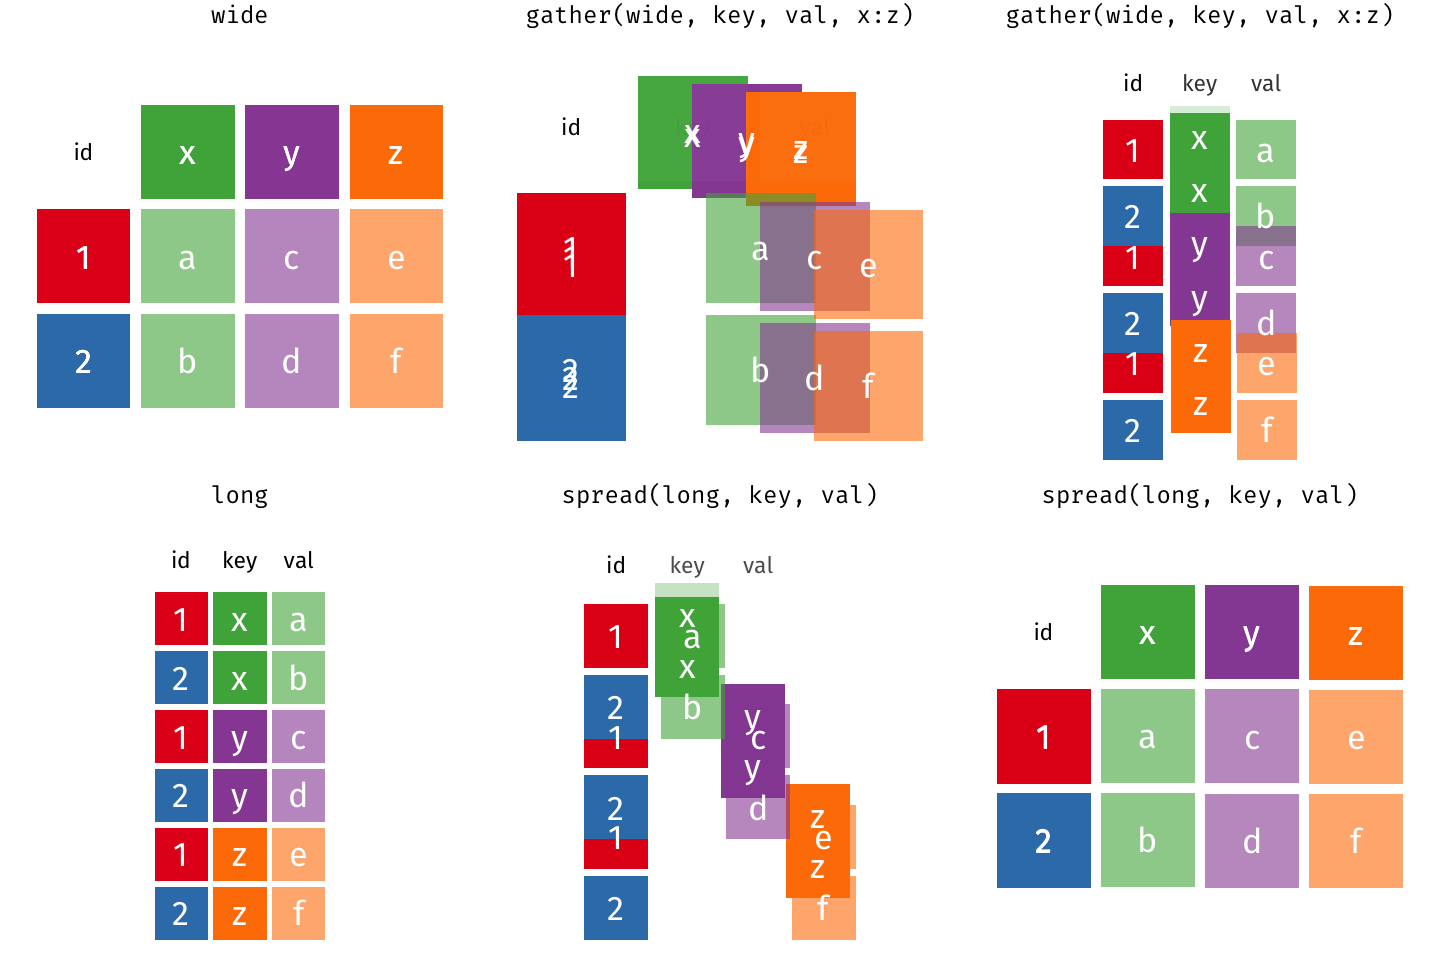
Recap: Tidy data - animation
7 / 35
Overview
- What is relational data?
- Keys
- Different sorts of joins
- Using joins to follow an aircraft flight path
8 / 35
Relational data
- Data analysis rarely involves only a single table of data.
- To answer questions you generally need to combine many tables of data
9 / 35
Relational data
- Multiple tables of data are called relational data
- It is the relations, not just the individual datasets, that are important.
10 / 35
nycflights13
- Data set of flights that departed NYC in 2013 from https://www.transtats.bts.gov - a public database of all USA commercial airline flights. It has five tables:
- flights
- airlines
- airports
- planes
- weather
11 / 35
flights
library(nycflights13)flights## # A tibble: 336,776 x 19## year month day dep_time sched_dep_time dep_delay arr_time sched_arr_time arr_delay## <int> <int> <int> <int> <int> <dbl> <int> <int> <dbl>## 1 2013 1 1 517 515 2 830 819 11## 2 2013 1 1 533 529 4 850 830 20## 3 2013 1 1 542 540 2 923 850 33## 4 2013 1 1 544 545 -1 1004 1022 -18## 5 2013 1 1 554 600 -6 812 837 -25## 6 2013 1 1 554 558 -4 740 728 12## 7 2013 1 1 555 600 -5 913 854 19## 8 2013 1 1 557 600 -3 709 723 -14## 9 2013 1 1 557 600 -3 838 846 -8## 10 2013 1 1 558 600 -2 753 745 8## # … with 336,766 more rows, and 10 more variables: carrier <chr>, flight <int>,## # tailnum <chr>, origin <chr>, dest <chr>, air_time <dbl>, distance <dbl>, hour <dbl>,## # minute <dbl>, time_hour <dttm>12 / 35
airlines
airlines## # A tibble: 16 x 2## carrier name ## <chr> <chr> ## 1 9E Endeavor Air Inc. ## 2 AA American Airlines Inc. ## 3 AS Alaska Airlines Inc. ## 4 B6 JetBlue Airways ## 5 DL Delta Air Lines Inc. ## 6 EV ExpressJet Airlines Inc. ## 7 F9 Frontier Airlines Inc. ## 8 FL AirTran Airways Corporation## 9 HA Hawaiian Airlines Inc. ## 10 MQ Envoy Air ## 11 OO SkyWest Airlines Inc. ## 12 UA United Air Lines Inc. ## 13 US US Airways Inc. ## 14 VX Virgin America ## 15 WN Southwest Airlines Co. ## 16 YV Mesa Airlines Inc.13 / 35
airports
airports## # A tibble: 1,458 x 8## faa name lat lon alt tz dst tzone ## <chr> <chr> <dbl> <dbl> <int> <dbl> <chr> <chr> ## 1 04G Lansdowne Airport 41.1 -80.6 1044 -5 A America/New_York ## 2 06A Moton Field Municipal Airport 32.5 -85.7 264 -6 A America/Chicago ## 3 06C Schaumburg Regional 42.0 -88.1 801 -6 A America/Chicago ## 4 06N Randall Airport 41.4 -74.4 523 -5 A America/New_York ## 5 09J Jekyll Island Airport 31.1 -81.4 11 -5 A America/New_York ## 6 0A9 Elizabethton Municipal Airport 36.4 -82.2 1593 -5 A America/New_York ## 7 0G6 Williams County Airport 41.5 -84.5 730 -5 A America/New_York ## 8 0G7 Finger Lakes Regional Airport 42.9 -76.8 492 -5 A America/New_York ## 9 0P2 Shoestring Aviation Airfield 39.8 -76.6 1000 -5 U America/New_York ## 10 0S9 Jefferson County Intl 48.1 -123. 108 -8 A America/Los_Angeles## # … with 1,448 more rows14 / 35
print-planes
planes## # A tibble: 3,322 x 9## tailnum year type manufacturer model engines seats speed engine ## <chr> <int> <chr> <chr> <chr> <int> <int> <int> <chr> ## 1 N10156 2004 Fixed wing multi e… EMBRAER EMB-145… 2 55 NA Turbo-f…## 2 N102UW 1998 Fixed wing multi e… AIRBUS INDUSTR… A320-214 2 182 NA Turbo-f…## 3 N103US 1999 Fixed wing multi e… AIRBUS INDUSTR… A320-214 2 182 NA Turbo-f…## 4 N104UW 1999 Fixed wing multi e… AIRBUS INDUSTR… A320-214 2 182 NA Turbo-f…## 5 N10575 2002 Fixed wing multi e… EMBRAER EMB-145… 2 55 NA Turbo-f…## 6 N105UW 1999 Fixed wing multi e… AIRBUS INDUSTR… A320-214 2 182 NA Turbo-f…## 7 N107US 1999 Fixed wing multi e… AIRBUS INDUSTR… A320-214 2 182 NA Turbo-f…## 8 N108UW 1999 Fixed wing multi e… AIRBUS INDUSTR… A320-214 2 182 NA Turbo-f…## 9 N109UW 1999 Fixed wing multi e… AIRBUS INDUSTR… A320-214 2 182 NA Turbo-f…## 10 N110UW 1999 Fixed wing multi e… AIRBUS INDUSTR… A320-214 2 182 NA Turbo-f…## # … with 3,312 more rows15 / 35
weather
weather## # A tibble: 26,115 x 15## origin year month day hour temp dewp humid wind_dir wind_speed wind_gust precip## <chr> <dbl> <dbl> <int> <int> <dbl> <dbl> <dbl> <dbl> <dbl> <dbl> <dbl>## 1 EWR 2013 1 1 1 39.0 26.1 59.4 270 10.4 NA 0## 2 EWR 2013 1 1 2 39.0 27.0 61.6 250 8.06 NA 0## 3 EWR 2013 1 1 3 39.0 28.0 64.4 240 11.5 NA 0## 4 EWR 2013 1 1 4 39.9 28.0 62.2 250 12.7 NA 0## 5 EWR 2013 1 1 5 39.0 28.0 64.4 260 12.7 NA 0## 6 EWR 2013 1 1 6 37.9 28.0 67.2 240 11.5 NA 0## 7 EWR 2013 1 1 7 39.0 28.0 64.4 240 15.0 NA 0## 8 EWR 2013 1 1 8 39.9 28.0 62.2 250 10.4 NA 0## 9 EWR 2013 1 1 9 39.9 28.0 62.2 260 15.0 NA 0## 10 EWR 2013 1 1 10 41 28.0 59.6 260 13.8 NA 0## # … with 26,105 more rows, and 3 more variables: pressure <dbl>, visib <dbl>,## # time_hour <dttm>16 / 35
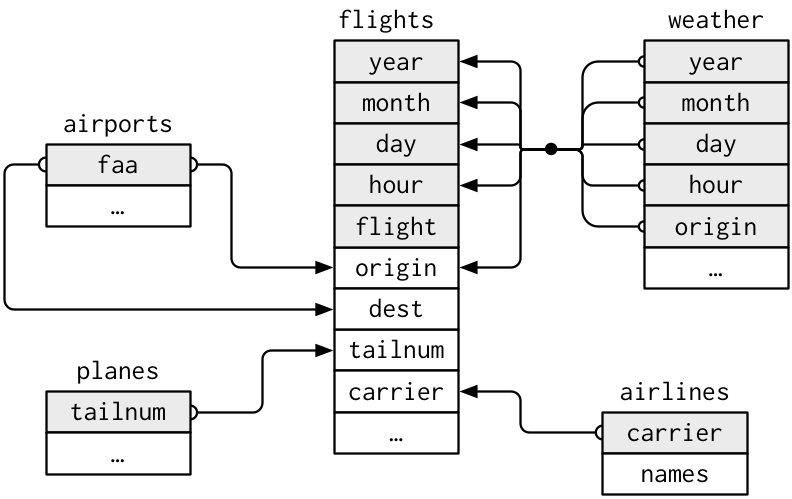
Concept map of tables and joins from the text
17 / 35
Keys 🔑
- Keys = variables used to connect records in one table to another.
- In the
nycflights13data,flightsconnects toplanesby a single variabletailnumflightsconnects toairlinesby a single variablecarrierflightsconnects toairportsby two variables,originanddestflightsconnects toweatherusing multiple variables,origin, andyear,month,dayandhour.
18 / 35
Your turn: go to rstudio.cloud
- Load the
Lahmanpackage, which contains multiple tables of baseball data. - What key(s) connect the batting table with the salary table?
- Can you draw out a diagram of the connections amongst the tables?
04:00
19 / 35
Joins
- "mutating joins", add variables from one table to another.
- There is always a decision on what observations are copied to the new table as well.
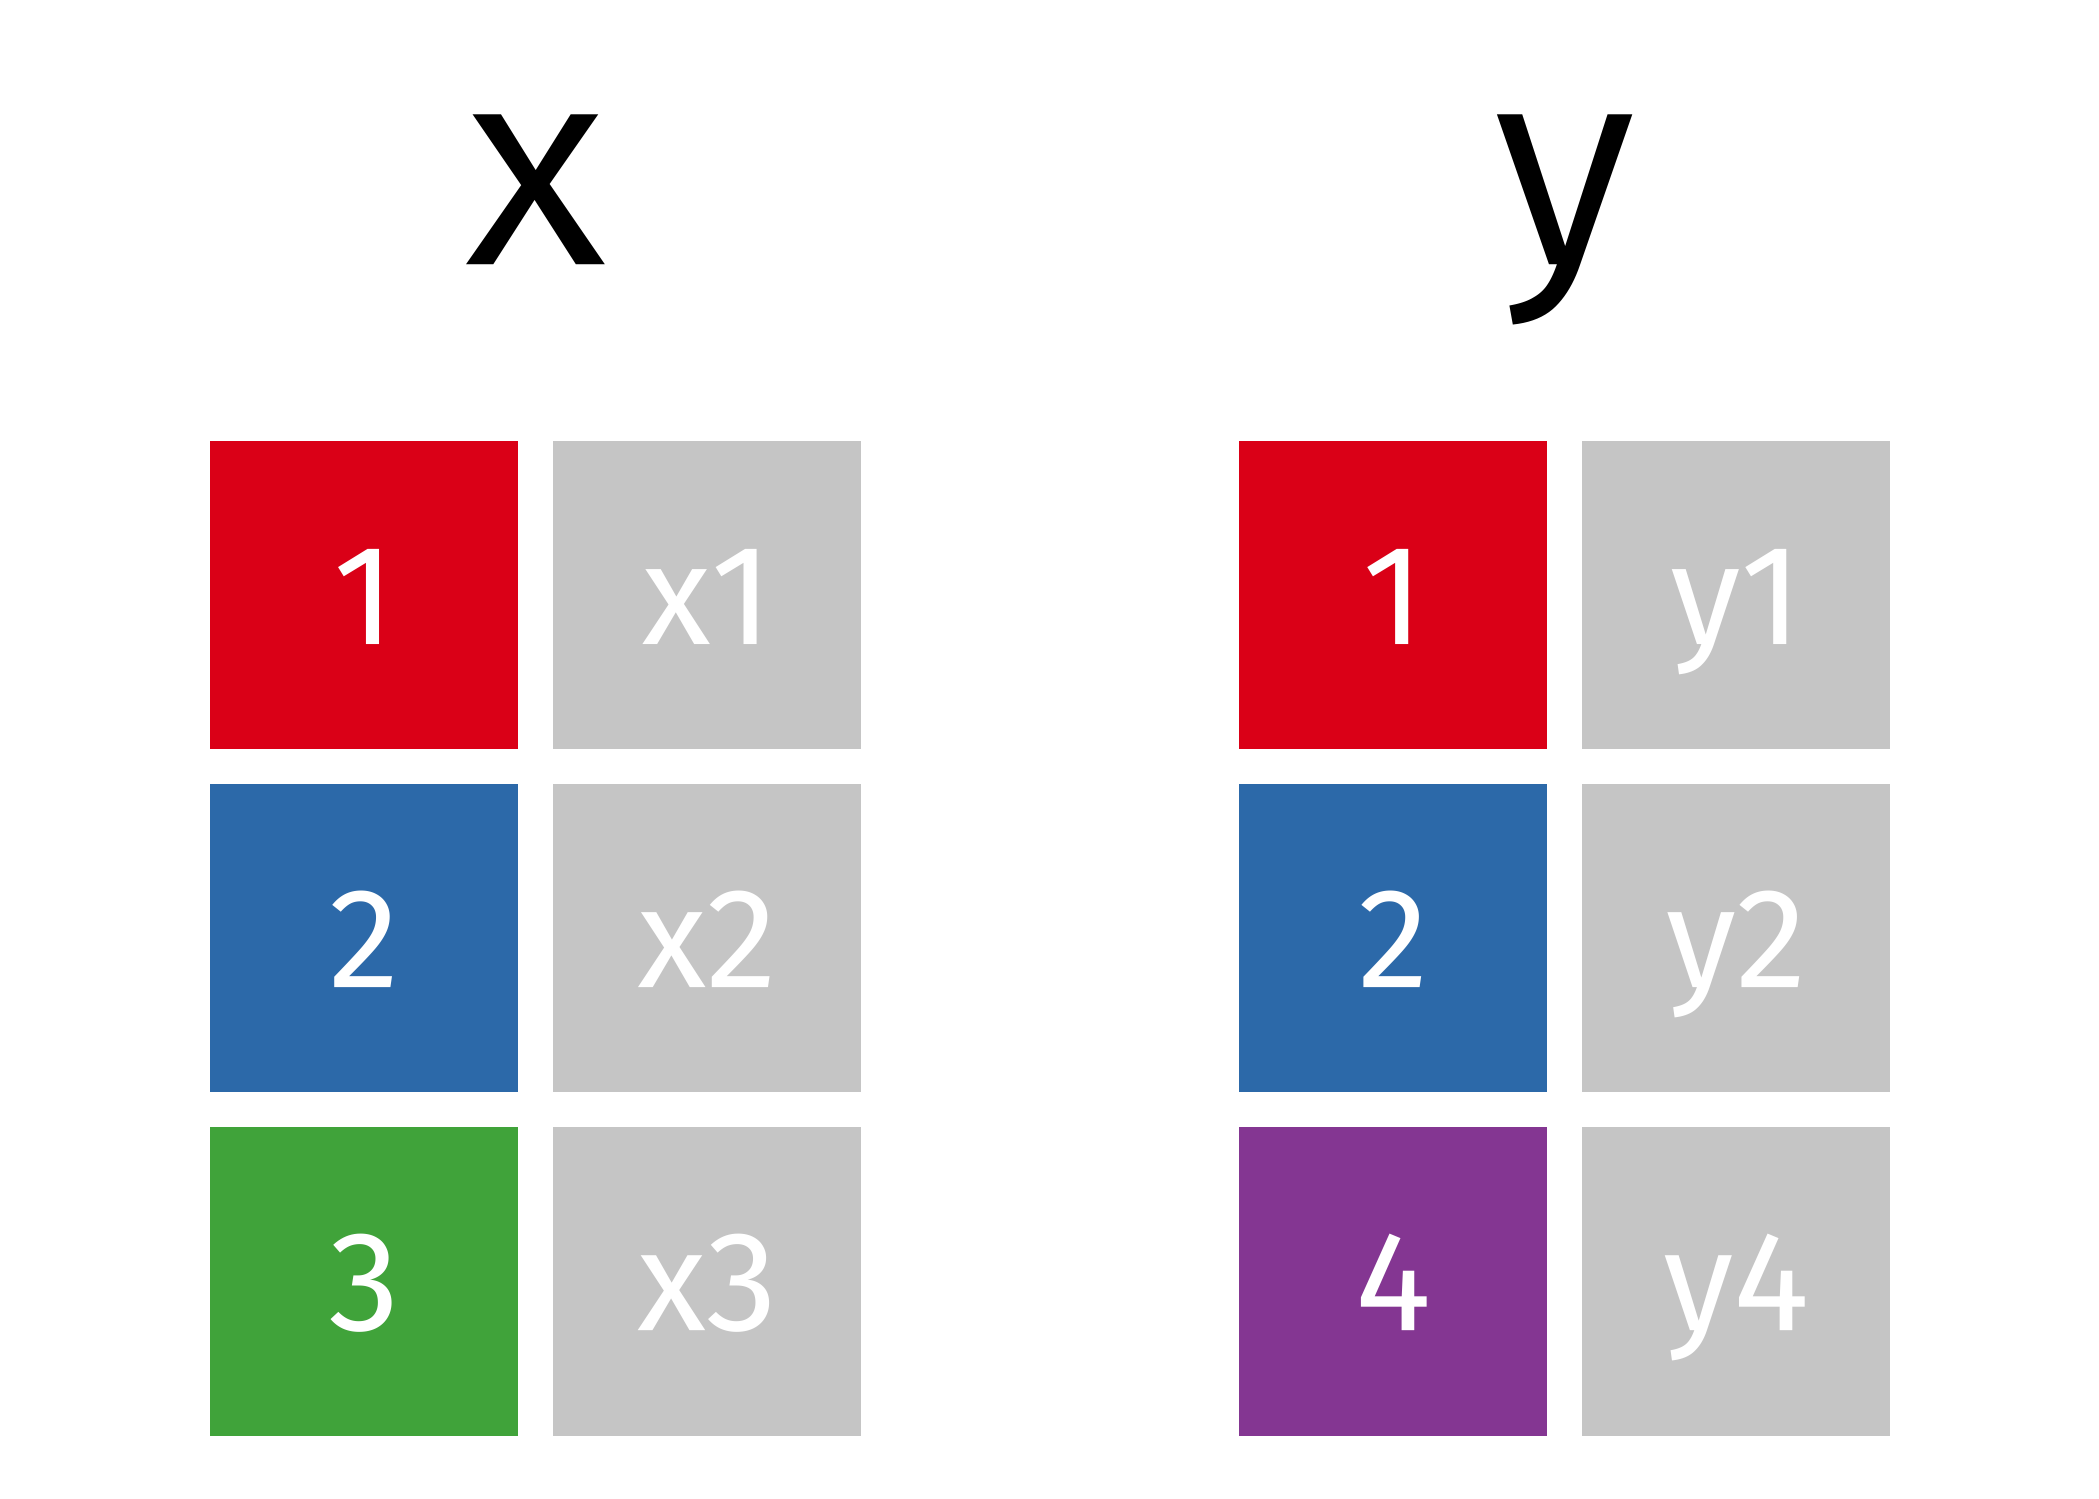
- Let's discuss how joins work using some lovely animations provided by Garrick Aden-Buie.
20 / 35
Example data
21 / 35
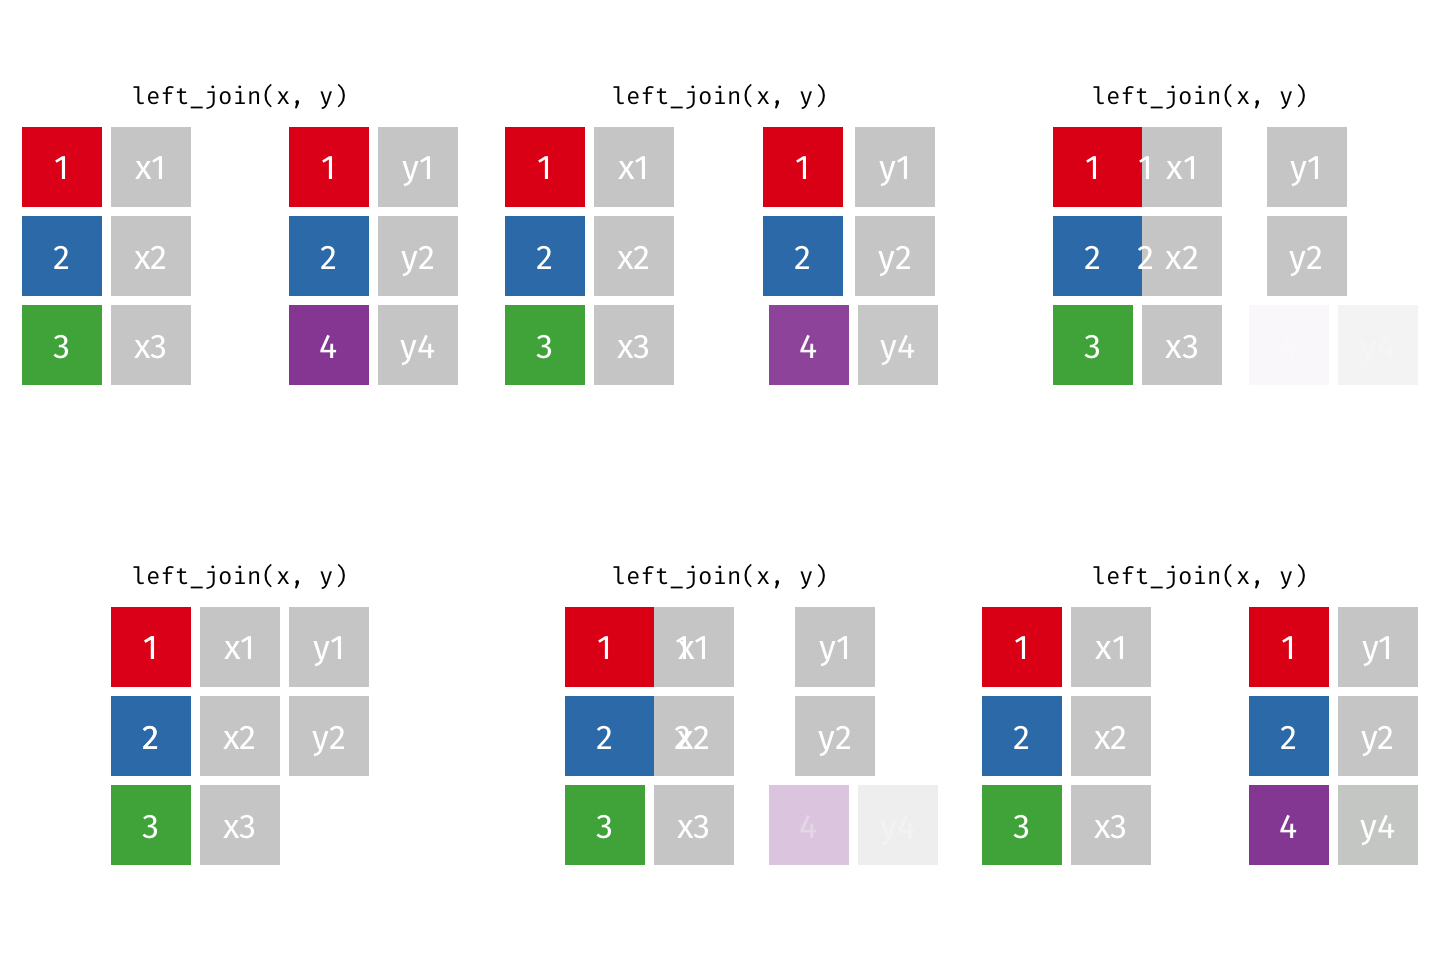
Left Join (Generally the one you want to use)
All observations from the "left" table, but only the observations from the "right" table that match those in the left.
22 / 35
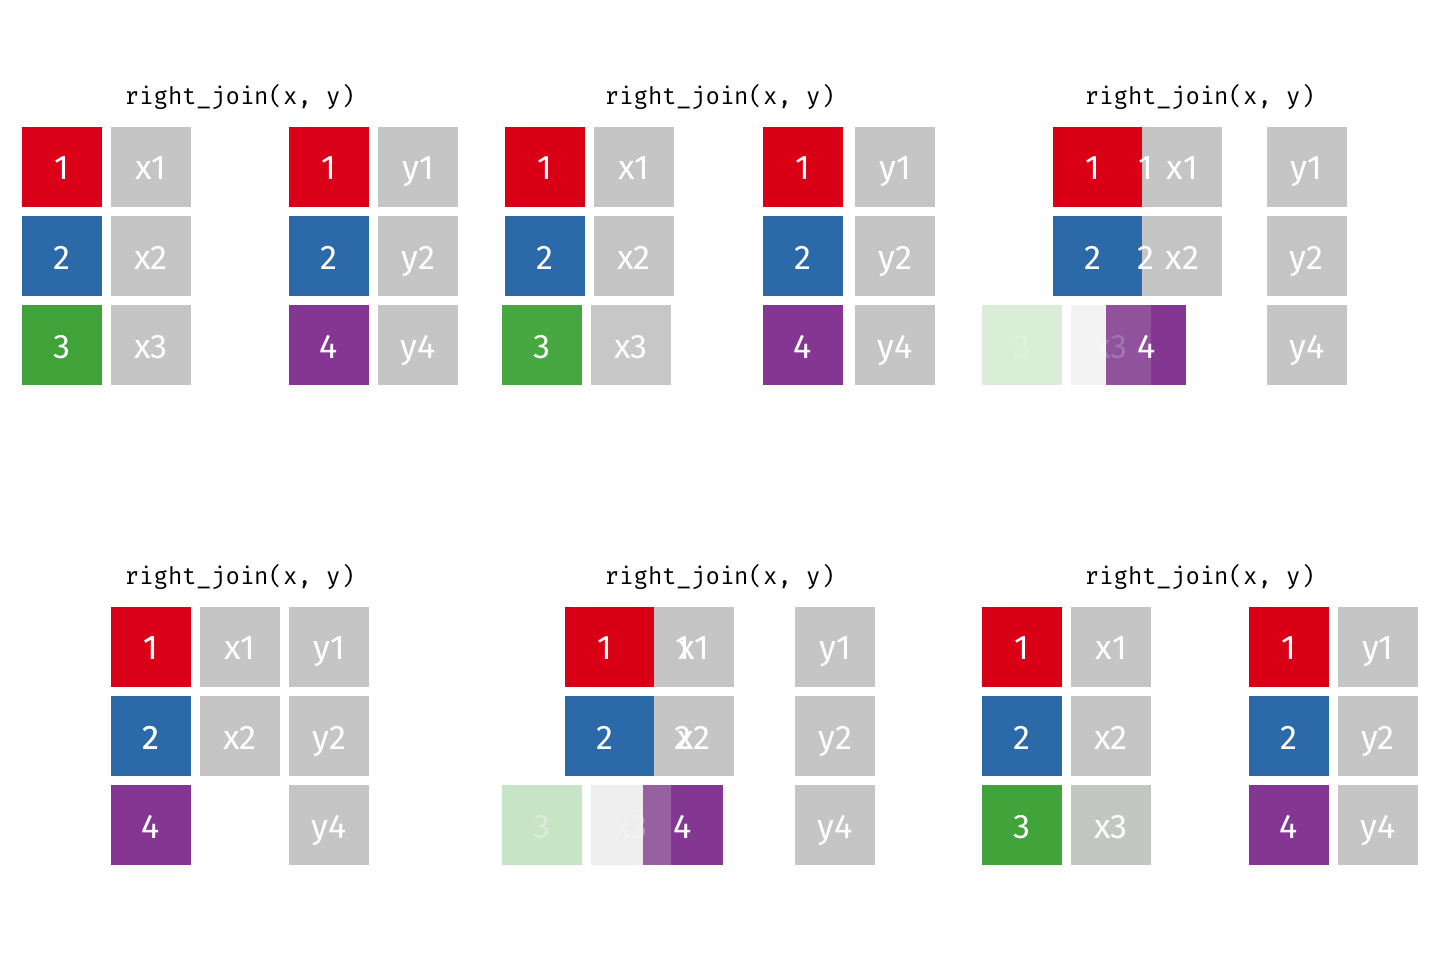
Right Join
Same as left join, but in reverse.
23 / 35
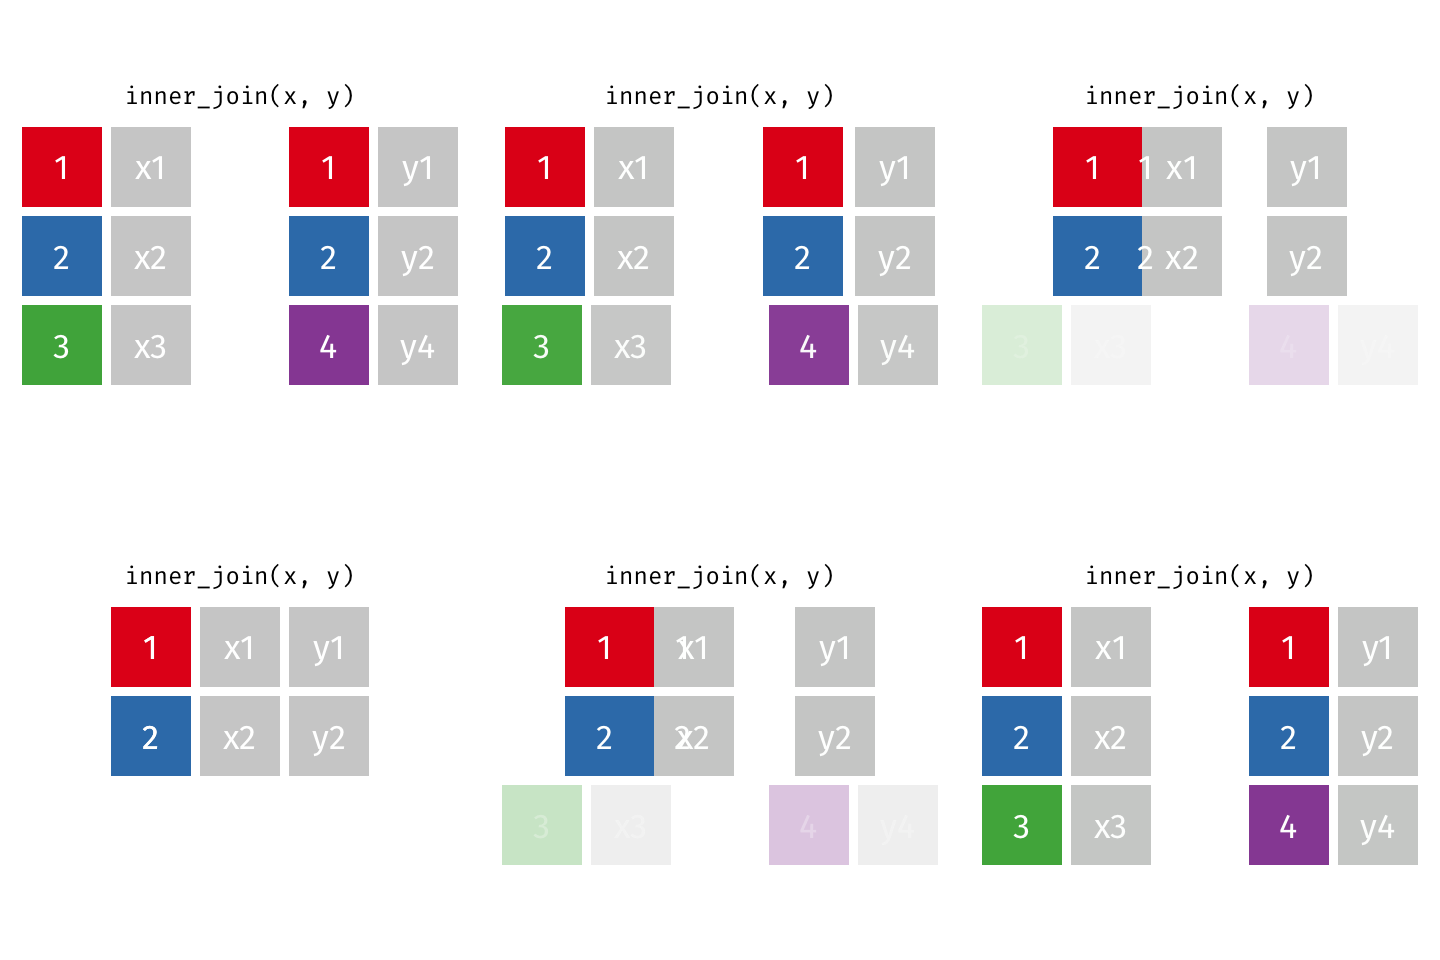
Inner join
Intersection between the two tables, only the observations that are in both
24 / 35
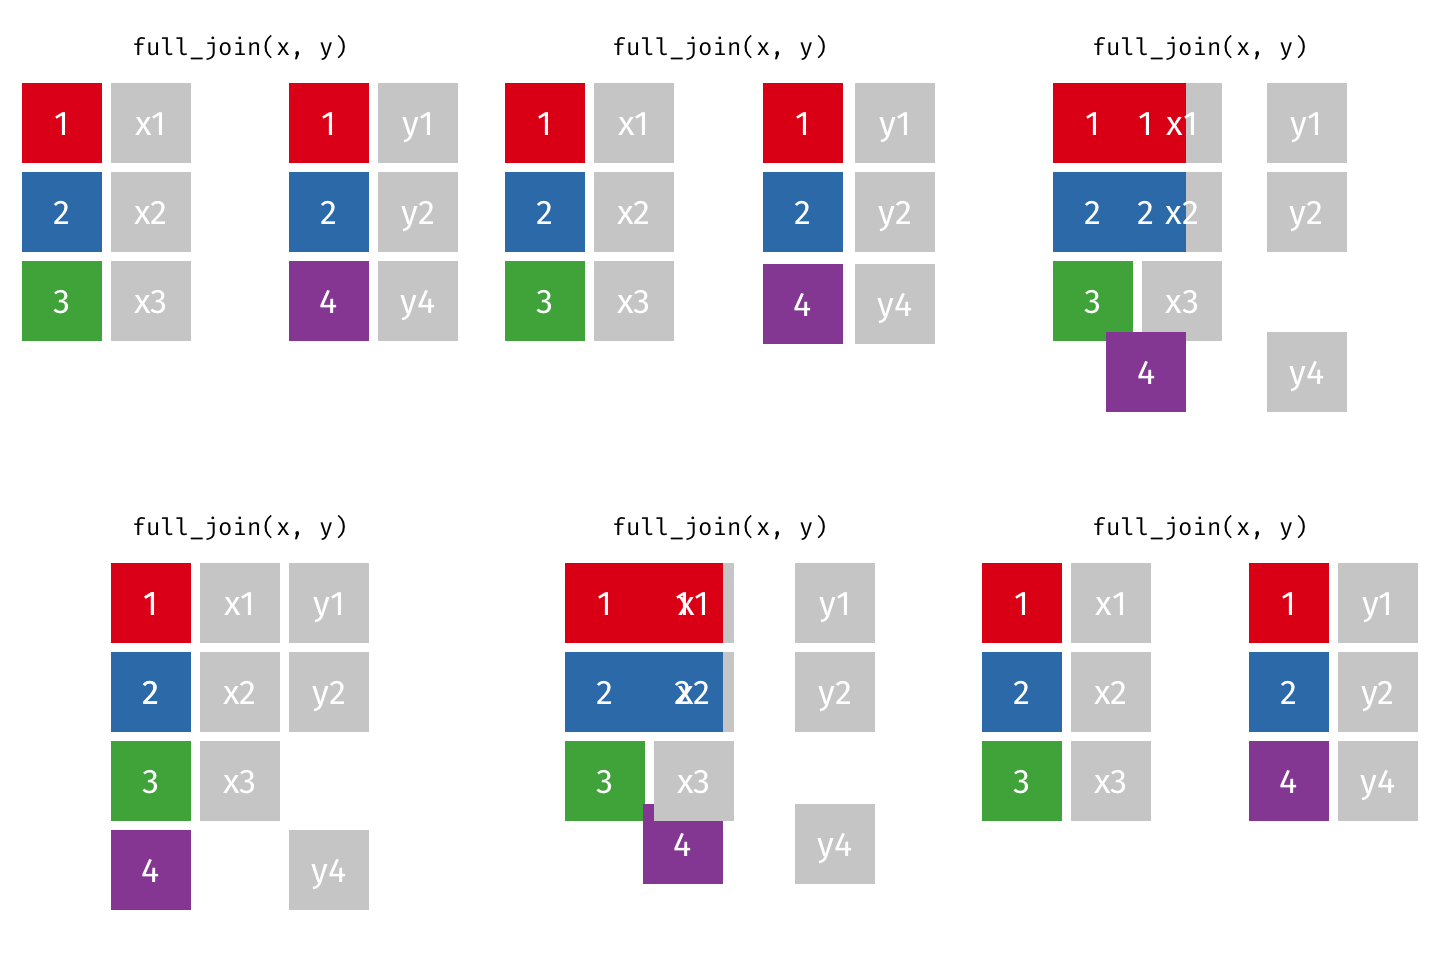
Outer (full) join
Union of the two tables, all observations from both, and missing values might get added
25 / 35
Example: What if you want to combine the full airline name to the flights data?
flights## # A tibble: 336,776 x 19## year month day dep_time sched_dep_time dep_delay arr_time sched_arr_time arr_delay## <int> <int> <int> <int> <int> <dbl> <int> <int> <dbl>## 1 2013 1 1 517 515 2 830 819 11## 2 2013 1 1 533 529 4 850 830 20## 3 2013 1 1 542 540 2 923 850 33## 4 2013 1 1 544 545 -1 1004 1022 -18## 5 2013 1 1 554 600 -6 812 837 -25## 6 2013 1 1 554 558 -4 740 728 12## 7 2013 1 1 555 600 -5 913 854 19## 8 2013 1 1 557 600 -3 709 723 -14## 9 2013 1 1 557 600 -3 838 846 -8## 10 2013 1 1 558 600 -2 753 745 8## # … with 336,766 more rows, and 10 more variables: carrier <chr>, flight <int>,## # tailnum <chr>, origin <chr>, dest <chr>, air_time <dbl>, distance <dbl>, hour <dbl>,## # minute <dbl>, time_hour <dttm>26 / 35
Example: What if you want to combine the full airline name to the flights data?
airlines## # A tibble: 16 x 2## carrier name ## <chr> <chr> ## 1 9E Endeavor Air Inc. ## 2 AA American Airlines Inc. ## 3 AS Alaska Airlines Inc. ## 4 B6 JetBlue Airways ## 5 DL Delta Air Lines Inc. ## 6 EV ExpressJet Airlines Inc. ## 7 F9 Frontier Airlines Inc. ## 8 FL AirTran Airways Corporation## 9 HA Hawaiian Airlines Inc. ## 10 MQ Envoy Air ## 11 OO SkyWest Airlines Inc. ## 12 UA United Air Lines Inc. ## 13 US US Airways Inc. ## 14 VX Virgin America ## 15 WN Southwest Airlines Co. ## 16 YV Mesa Airlines Inc.27 / 35
Example: Combine airlines and flights data frames with left_join().
flights %>% left_join(airlines, by = "carrier") %>% glimpse()## Observations: 336,776## Variables: 20## $ year <int> 2013, 2013, 2013, 2013, 2013, 2013, 2013, 2013, 2013, 2013, 2013…## $ month <int> 1, 1, 1, 1, 1, 1, 1, 1, 1, 1, 1, 1, 1, 1, 1, 1, 1, 1, 1, 1, 1, 1…## $ day <int> 1, 1, 1, 1, 1, 1, 1, 1, 1, 1, 1, 1, 1, 1, 1, 1, 1, 1, 1, 1, 1, 1…## $ dep_time <int> 517, 533, 542, 544, 554, 554, 555, 557, 557, 558, 558, 558, 558,…## $ sched_dep_time <int> 515, 529, 540, 545, 600, 558, 600, 600, 600, 600, 600, 600, 600,…## $ dep_delay <dbl> 2, 4, 2, -1, -6, -4, -5, -3, -3, -2, -2, -2, -2, -2, -1, 0, -1, …## $ arr_time <int> 830, 850, 923, 1004, 812, 740, 913, 709, 838, 753, 849, 853, 924…## $ sched_arr_time <int> 819, 830, 850, 1022, 837, 728, 854, 723, 846, 745, 851, 856, 917…## $ arr_delay <dbl> 11, 20, 33, -18, -25, 12, 19, -14, -8, 8, -2, -3, 7, -14, 31, -4…## $ carrier <chr> "UA", "UA", "AA", "B6", "DL", "UA", "B6", "EV", "B6", "AA", "B6"…## $ flight <int> 1545, 1714, 1141, 725, 461, 1696, 507, 5708, 79, 301, 49, 71, 19…## $ tailnum <chr> "N14228", "N24211", "N619AA", "N804JB", "N668DN", "N39463", "N51…## $ origin <chr> "EWR", "LGA", "JFK", "JFK", "LGA", "EWR", "EWR", "LGA", "JFK", "…## $ dest <chr> "IAH", "IAH", "MIA", "BQN", "ATL", "ORD", "FLL", "IAD", "MCO", "…## $ air_time <dbl> 227, 227, 160, 183, 116, 150, 158, 53, 140, 138, 149, 158, 345, …## $ distance <dbl> 1400, 1416, 1089, 1576, 762, 719, 1065, 229, 944, 733, 1028, 100…## $ hour <dbl> 5, 5, 5, 5, 6, 5, 6, 6, 6, 6, 6, 6, 6, 6, 6, 5, 6, 6, 6, 6, 6, 6…## $ minute <dbl> 15, 29, 40, 45, 0, 58, 0, 0, 0, 0, 0, 0, 0, 0, 0, 59, 0, 0, 0, 0…## $ time_hour <dttm> 2013-01-01 05:00:00, 2013-01-01 05:00:00, 2013-01-01 05:00:00, …## $ name <chr> "United Air Lines Inc.", "United Air Lines Inc.", "American Airl…28 / 35
Example: flights joining to airports
flights %>% left_join( airports, by = c("origin" = "faa")) %>% glimpse()## Observations: 336,776## Variables: 26## $ year <int> 2013, 2013, 2013, 2013, 2013, 2013, 2013, 2013, 2013, 2013, 2013…## $ month <int> 1, 1, 1, 1, 1, 1, 1, 1, 1, 1, 1, 1, 1, 1, 1, 1, 1, 1, 1, 1, 1, 1…## $ day <int> 1, 1, 1, 1, 1, 1, 1, 1, 1, 1, 1, 1, 1, 1, 1, 1, 1, 1, 1, 1, 1, 1…## $ dep_time <int> 517, 533, 542, 544, 554, 554, 555, 557, 557, 558, 558, 558, 558,…## $ sched_dep_time <int> 515, 529, 540, 545, 600, 558, 600, 600, 600, 600, 600, 600, 600,…## $ dep_delay <dbl> 2, 4, 2, -1, -6, -4, -5, -3, -3, -2, -2, -2, -2, -2, -1, 0, -1, …## $ arr_time <int> 830, 850, 923, 1004, 812, 740, 913, 709, 838, 753, 849, 853, 924…## $ sched_arr_time <int> 819, 830, 850, 1022, 837, 728, 854, 723, 846, 745, 851, 856, 917…## $ arr_delay <dbl> 11, 20, 33, -18, -25, 12, 19, -14, -8, 8, -2, -3, 7, -14, 31, -4…## $ carrier <chr> "UA", "UA", "AA", "B6", "DL", "UA", "B6", "EV", "B6", "AA", "B6"…## $ flight <int> 1545, 1714, 1141, 725, 461, 1696, 507, 5708, 79, 301, 49, 71, 19…## $ tailnum <chr> "N14228", "N24211", "N619AA", "N804JB", "N668DN", "N39463", "N51…## $ origin <chr> "EWR", "LGA", "JFK", "JFK", "LGA", "EWR", "EWR", "LGA", "JFK", "…## $ dest <chr> "IAH", "IAH", "MIA", "BQN", "ATL", "ORD", "FLL", "IAD", "MCO", "…## $ air_time <dbl> 227, 227, 160, 183, 116, 150, 158, 53, 140, 138, 149, 158, 345, …## $ distance <dbl> 1400, 1416, 1089, 1576, 762, 719, 1065, 229, 944, 733, 1028, 100…## $ hour <dbl> 5, 5, 5, 5, 6, 5, 6, 6, 6, 6, 6, 6, 6, 6, 6, 5, 6, 6, 6, 6, 6, 6…## $ minute <dbl> 15, 29, 40, 45, 0, 58, 0, 0, 0, 0, 0, 0, 0, 0, 0, 59, 0, 0, 0, 0…## $ time_hour <dttm> 2013-01-01 05:00:00, 2013-01-01 05:00:00, 2013-01-01 05:00:00, …## $ name <chr> "Newark Liberty Intl", "La Guardia", "John F Kennedy Intl", "Joh…## $ lat <dbl> 40.69250, 40.77725, 40.63975, 40.63975, 40.77725, 40.69250, 40.6…## $ lon <dbl> -74.16867, -73.87261, -73.77893, -73.77893, -73.87261, -74.16867…## $ alt <int> 18, 22, 13, 13, 22, 18, 18, 22, 13, 22, 13, 13, 13, 18, 22, 13, …## $ tz <dbl> -5, -5, -5, -5, -5, -5, -5, -5, -5, -5, -5, -5, -5, -5, -5, -5, …## $ dst <chr> "A", "A", "A", "A", "A", "A", "A", "A", "A", "A", "A", "A", "A",…## $ tzone <chr> "America/New_York", "America/New_York", "America/New_York", "Ame…29 / 35
Airline travel, ontime data
plane_N4YRAA <- read_csv("data/plane_N4YRAA.csv")glimpse(plane_N4YRAA)## Observations: 145## Variables: 8## $ FL_DATE <date> 2017-05-26, 2017-05-02, 2017-05-05, 2017-05-11, 2017-05-03, 2017-05-0…## $ CARRIER <chr> "AA", "AA", "AA", "AA", "AA", "AA", "AA", "AA", "AA", "AA", "AA", "AA"…## $ FL_NUM <dbl> 2246, 2276, 2278, 2287, 2288, 2291, 2297, 2297, 2297, 2297, 2302, 2302…## $ ORIGIN <chr> "CVG", "DFW", "DFW", "STL", "IND", "CHS", "DFW", "DFW", "MKE", "MKE", …## $ DEST <chr> "DFW", "IND", "OKC", "ORD", "DFW", "DFW", "MKE", "MKE", "DFW", "DFW", …## $ DEP_TIME <chr> "0748", "2020", "0848", "0454", "0601", "0807", "0700", "0659", "1000"…## $ ARR_TIME <chr> "0917", "2323", "0941", "0600", "0719", "0947", "0905", "0909", "1223"…## $ DISTANCE <dbl> 812, 761, 175, 258, 761, 987, 853, 853, 853, 853, 447, 447, 761, 802, …30 / 35
Airline travel, airport location
airport_raw <- read_csv("data/airports.csv")airport_raw %>% select(AIRPORT, LATITUDE, LONGITUDE, AIRPORT_STATE_NAME) %>% glimpse()## Observations: 13,094## Variables: 4## $ AIRPORT <chr> "01A", "03A", "04A", "05A", "06A", "07A", "08A", "09A", "1B1…## $ LATITUDE <dbl> 58.10944, 65.54806, 68.08333, 67.57000, 57.74528, 55.55472, …## $ LONGITUDE <dbl> -152.90667, -161.07167, -163.16667, -148.18389, -152.88278, …## $ AIRPORT_STATE_NAME <chr> "Alaska", "Alaska", "Alaska", "Alaska", "Alaska", "Alaska", …31 / 35
Our Turn: Joining the two tables to show flight movements
- Go to rstudio.cloud and open "flight-movements.Rmd" and complete exercise - the aim is to show flight movement on the map
- Next: Open "nycflights.Rmd"
32 / 35
Learning more
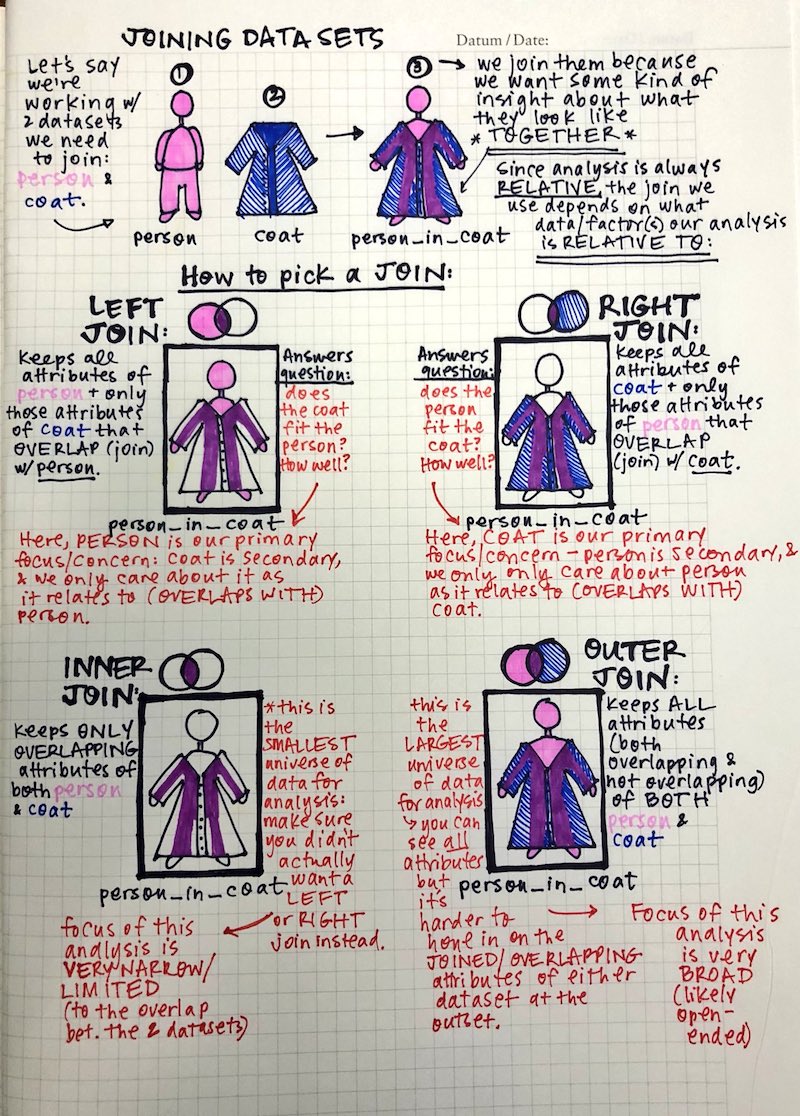
- The coat explanation of joins: Different types of joins explained using a person and a coat, by Leight Tami
33 / 35
References
- Chapter 13 of R4DS
34 / 35
Share and share alike

This work is licensed under a Creative Commons Attribution 4.0 International License.
35 / 35