ETC1010: Data Modelling and Computing
Week of Data Visualisation: Lecture 3
Dr. Nicholas Tierney & Professor Di Cook
EBS, Monash U.
2019-08-14
Learning Tips
Understanding learning
- Growth and fixed mindsets
- Reframe success + failure as opportunities for growth
- Growing area of research by Carol Dweck of Stanford
Reframing
From
"I'll never understand"
"I just don't get programming"
"I'm not a maths person"
Reframing
From
"I'll never understand"
"I just don't get programming"
"I'm not a maths person"
To
"I understand more than I did yesterday"
"I can learn how to program"
"Compared to this last week, I've learnt quite a bit!"
Overview for today
- Going from tidy data to a data plot, using a grammar
- Mapping of variables from the data to graphical elements
- Using different geoms
Example: Tuberculosis data
The case notifications table From WHO.
Data is tidied here, with only counts for Australia.
tb_au## # A tibble: 192 x 6## country iso3 year count gender age ## <chr> <chr> <dbl> <dbl> <chr> <chr>## 1 Australia AUS 1997 8 m 1524 ## 2 Australia AUS 1998 11 m 1524 ## 3 Australia AUS 1999 13 m 1524 ## 4 Australia AUS 2000 16 m 1524 ## 5 Australia AUS 2001 23 m 1524 ## 6 Australia AUS 2002 15 m 1524 ## 7 Australia AUS 2003 14 m 1524 ## 8 Australia AUS 2004 18 m 1524 ## 9 Australia AUS 2005 32 m 1524 ## 10 Australia AUS 2006 33 m 1524 ## # … with 182 more rowsThe "100% charts"
ggplot(tb_au, aes(x = year, y = count, fill = gender)) + geom_bar(stat = "identity", position = "fill") + facet_grid(~ age) + scale_fill_brewer(palette="Dark2")
100% charts, is what excel names these beasts. What do we learn?
Let's unpack a bit.
Data Visualisation
"The simple graph has brought more information to the data analyst’s mind than any other device." — John Tukey
Data Visualisation
- The creation and study of the visual representation of data.
- Many tools for visualizing data (R is one of them)
- Many approaches/systems within R for making data visualizations (ggplot2 is one of them, and that's what we're going to use).
ggplot2 ∈ tidyverse

- ggplot2 is tidyverse's data visualization package
- The
ggin "ggplot2" stands for Grammar of Graphics - It is inspired by the book Grammar of Graphics by Leland Wilkinson †
- A grammar of graphics is a tool that enables us to concisely describe the components of a graphic
† Source: BloggoType
Our first ggplot!
library(ggplot2)ggplot(tb_au)
Our first ggplot!
library(ggplot2)ggplot(tb_au, aes(x = year, y = count))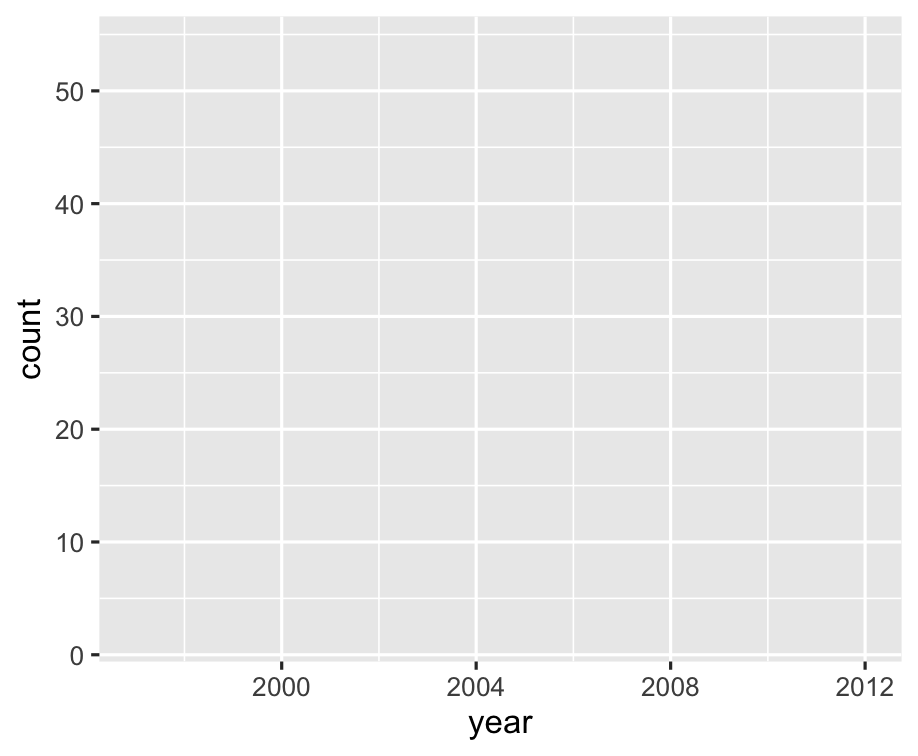
Our first ggplot!
library(ggplot2)ggplot(tb_au, aes(x = year, y = count)) + geom_point()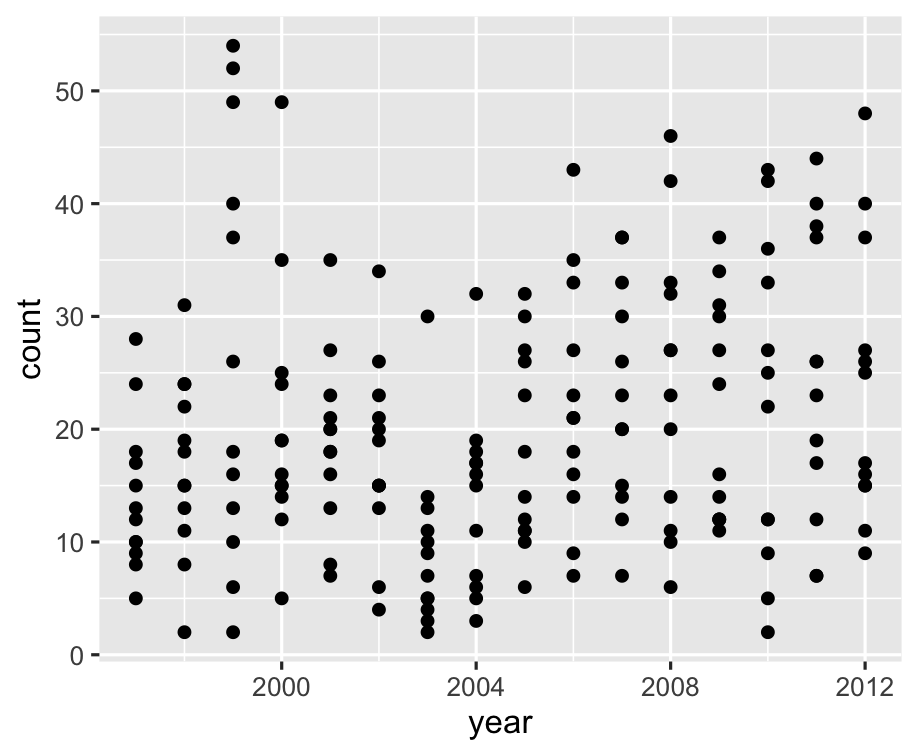
Our first ggplot! (what's the data again?)
| country | iso3 | year | count | gender | age |
|---|---|---|---|---|---|
| Australia | AUS | 1997 | 8 | m | 1524 |
| Australia | AUS | 1998 | 11 | m | 1524 |
| Australia | AUS | 1999 | 13 | m | 1524 |
| Australia | AUS | 2000 | 16 | m | 1524 |
| Australia | AUS | 2001 | 23 | m | 1524 |
| Australia | AUS | 2002 | 15 | m | 1524 |
| Australia | AUS | 2003 | 14 | m | 1524 |
| Australia | AUS | 2004 | 18 | m | 1524 |
| Australia | AUS | 2005 | 32 | m | 1524 |
| Australia | AUS | 2006 | 33 | m | 1524 |
Our first ggplot!
library(ggplot2)ggplot(tb_au, aes(x = year, y = count)) + geom_col()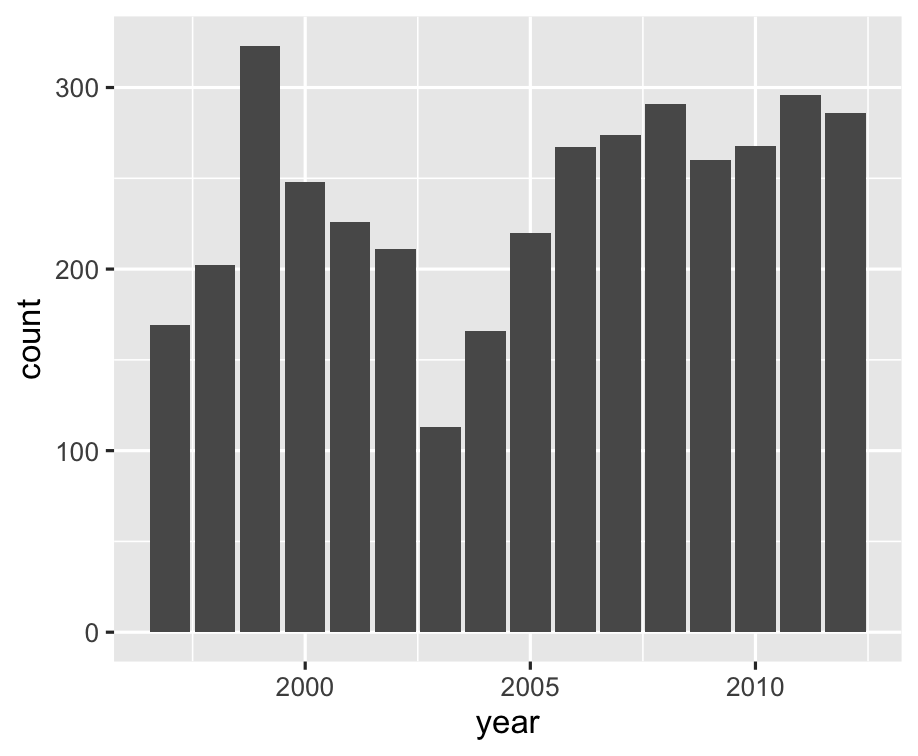
Our first ggplot!
library(ggplot2)ggplot(tb_au, aes(x = year, y = count, fill = gender)) + geom_col()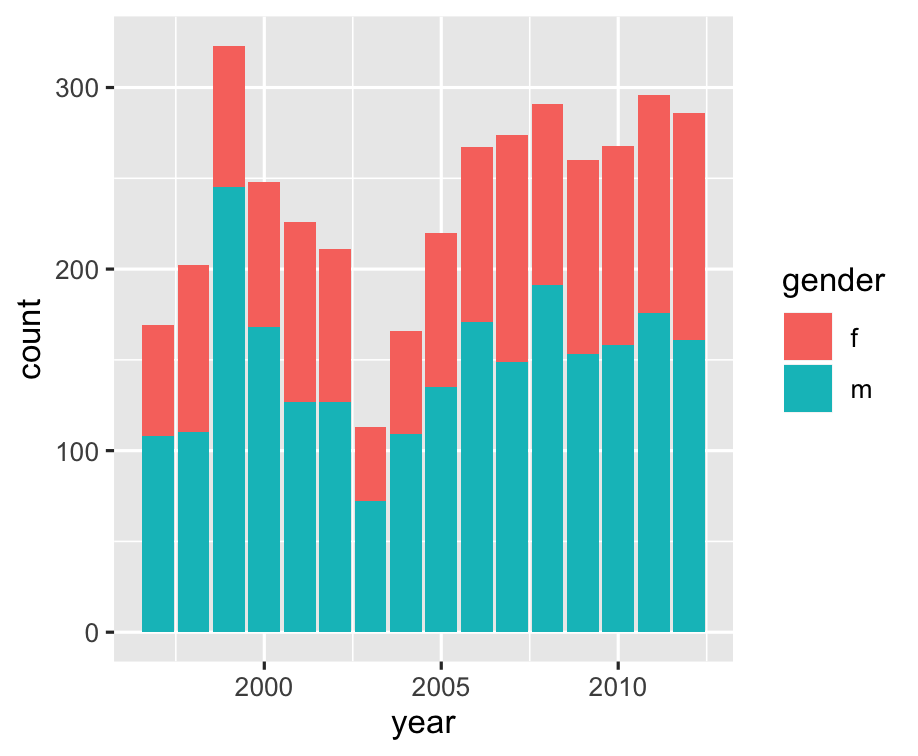
Our first ggplot!
library(ggplot2)ggplot(tb_au, aes(x = year, y = count, fill = gender)) + geom_col(position = "fill")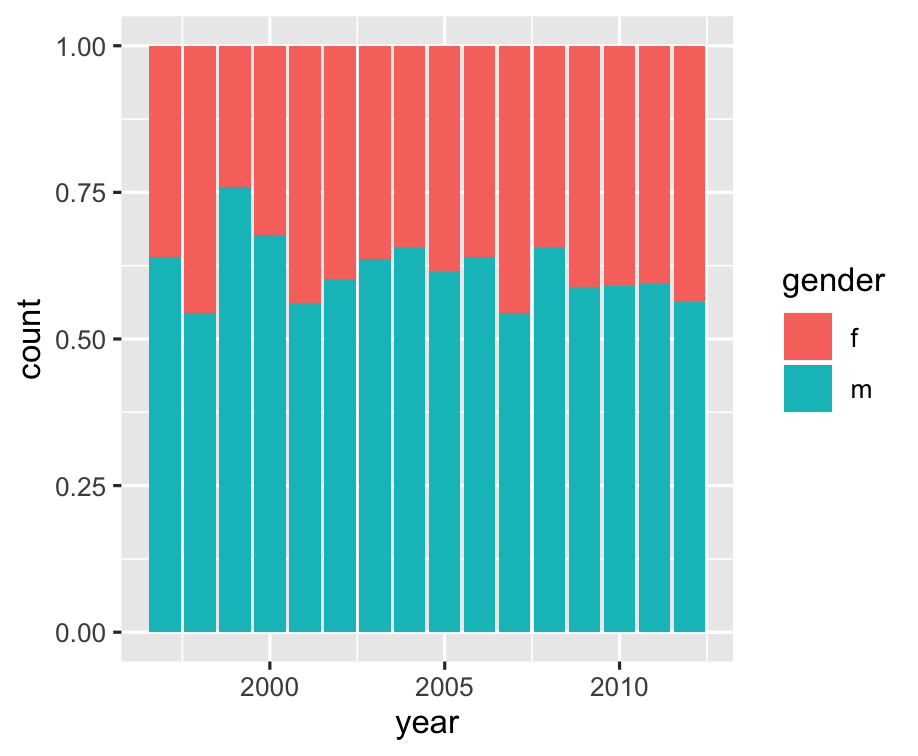
Our first ggplot!
library(ggplot2)ggplot(tb_au, aes(x = year, y = count, fill = gender)) + geom_col(position = "fill") + scale_fill_brewer( palette = "Dark2" )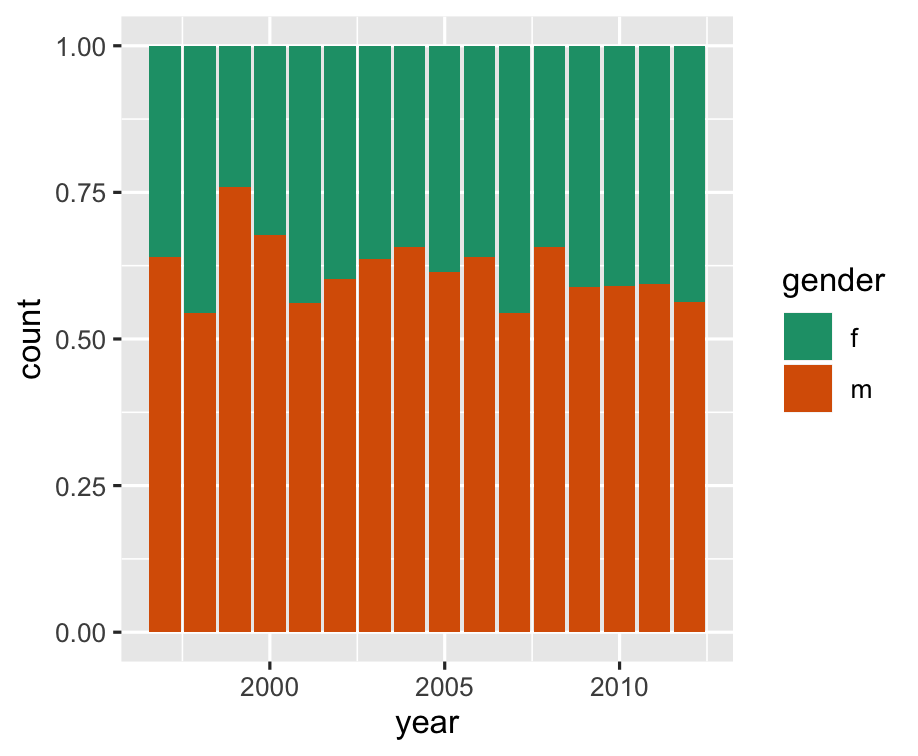
Our first ggplot!
library(ggplot2)ggplot(tb_au, aes(x = year, y = count, fill = gender)) + geom_col(position = "fill") + scale_fill_brewer( palette = "Dark2" ) + facet_wrap(~ age)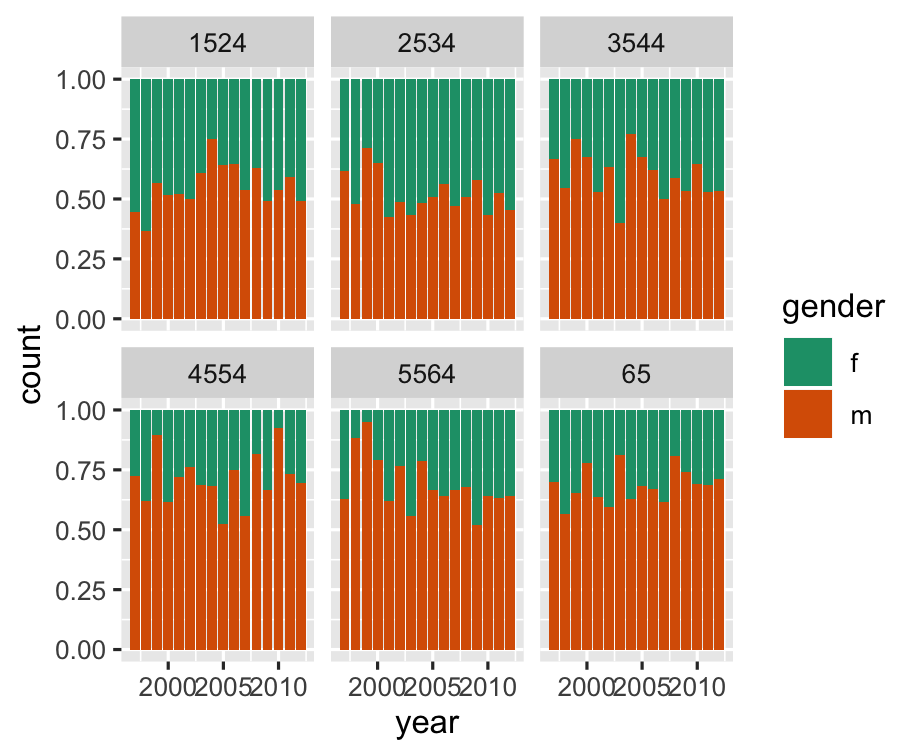
- First argument provided is the name of the data,
tb_au - Variable mapping: year is mapped to x, count is mapped to y, gender is mapped to colour, and age is used to subset the data and make separate plots
- The column geom is used,
geom_col - We are mostly interested in proportions between gender, over years, separately by age. The
position = "fill"option ingeom_barsets the heights of the bars to be all at 100%. It ignores counts, and emphasizes the proportion of males and females.
The "100% charts"
ggplot(tb_au, aes(x = year, y = count, fill = gender)) + geom_bar(stat = "identity", position = "fill") + facet_grid(~ age) + scale_fill_brewer(palette="Dark2")
The "100% charts"
ggplot(tb_au, aes(x = year, y = count, fill = gender)) + geom_bar(stat = "identity", position = "fill") + facet_grid(~ age) + scale_fill_brewer(palette="Dark2")
What do we learn
100% charts, is what excel names these beasts. What do we learn?
What do we learn?
- Focus is on proportion in each category.
- Across (almost) all ages, and years, the proportion of males having TB is higher than females
- These proportions tend to be higher in the older age groups, for all years.
Code structure of ggplot
ggplot()is the main function- Plots are constructed in layers
- Structure of code for plots can often be summarised as
ggplot(data = [dataset], mapping = aes(x = [x-variable], y = [y-variable])) + geom_xxx() + other optionsHow to use ggplot
- To use ggplot2 functions, first load tidyverse
library(tidyverse)- For help with the ggplot2, see ggplot2.tidyverse.org
Let's look at some more options to emphasise different features
ggplot(tb_au, aes(x = year, y = count, fill = gender)) + geom_col(position = "fill") + scale_fill_brewer( palette = "Dark2" ) + facet_wrap(~ age)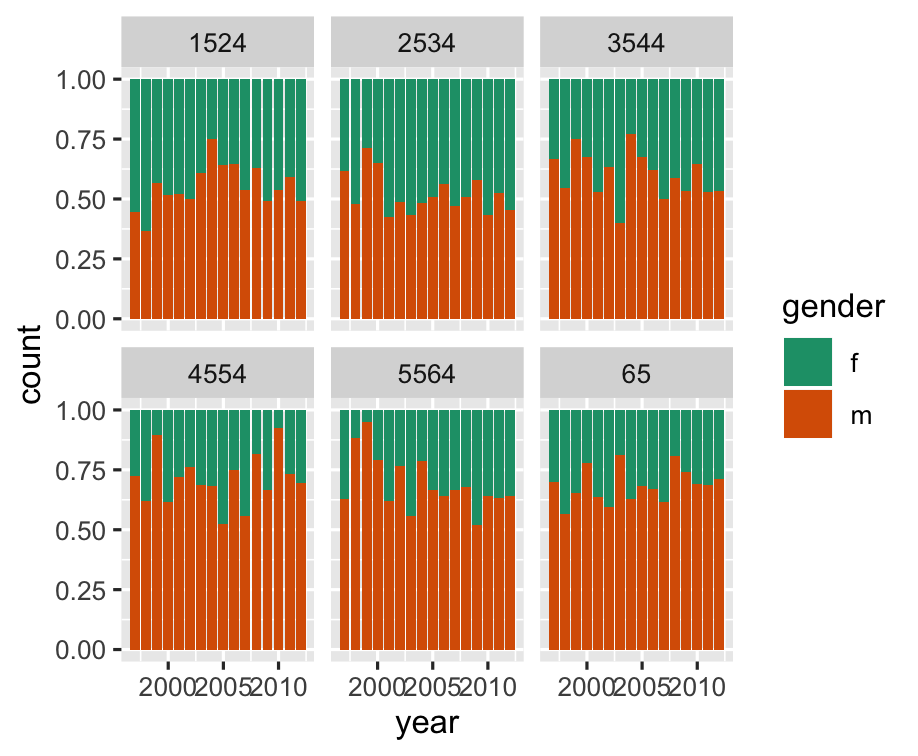
Emphasizing different features with ggplot2
ggplot(tb_au, aes(x = year, y = count, fill = gender)) + geom_col(position = "fill") + scale_fill_brewer( palette = "Dark2") + facet_grid(~ age)
Emphasise ... ?
ggplot(tb_au, aes(x = year, y = count, fill = gender)) + geom_col() + scale_fill_brewer( palette = "Dark2") + facet_grid(~ age)
What do we learn?
, position = "fill"was removed- Focus is on counts in each category.
- Different across ages, and years, counts tend to be lower in middle age (45-64)
- 1999 saw a bit of an outbreak, in most age groups, with numbers doubling or tripling other years.
- Incidence has been increasing among younger age groups in recent years.
Emphasise ... ?
ggplot(tb_au, aes(x = year, y = count, fill = gender)) + geom_col(position = "dodge") + scale_fill_brewer(palette = "Dark2") + facet_grid(~ age)
What do we learn?
, position="dodge"is used ingeom_col- Focus is on counts by gender, predominantly male incidence.
- Incidence among males relative to females is from middle age on.
- There is similar incidence between males and females in younger age groups.
Separate bar charts
ggplot(tb_au, aes(x = year, y = count, fill = gender)) + geom_col() + scale_fill_brewer(palette = "Dark2") + facet_grid(gender ~ age)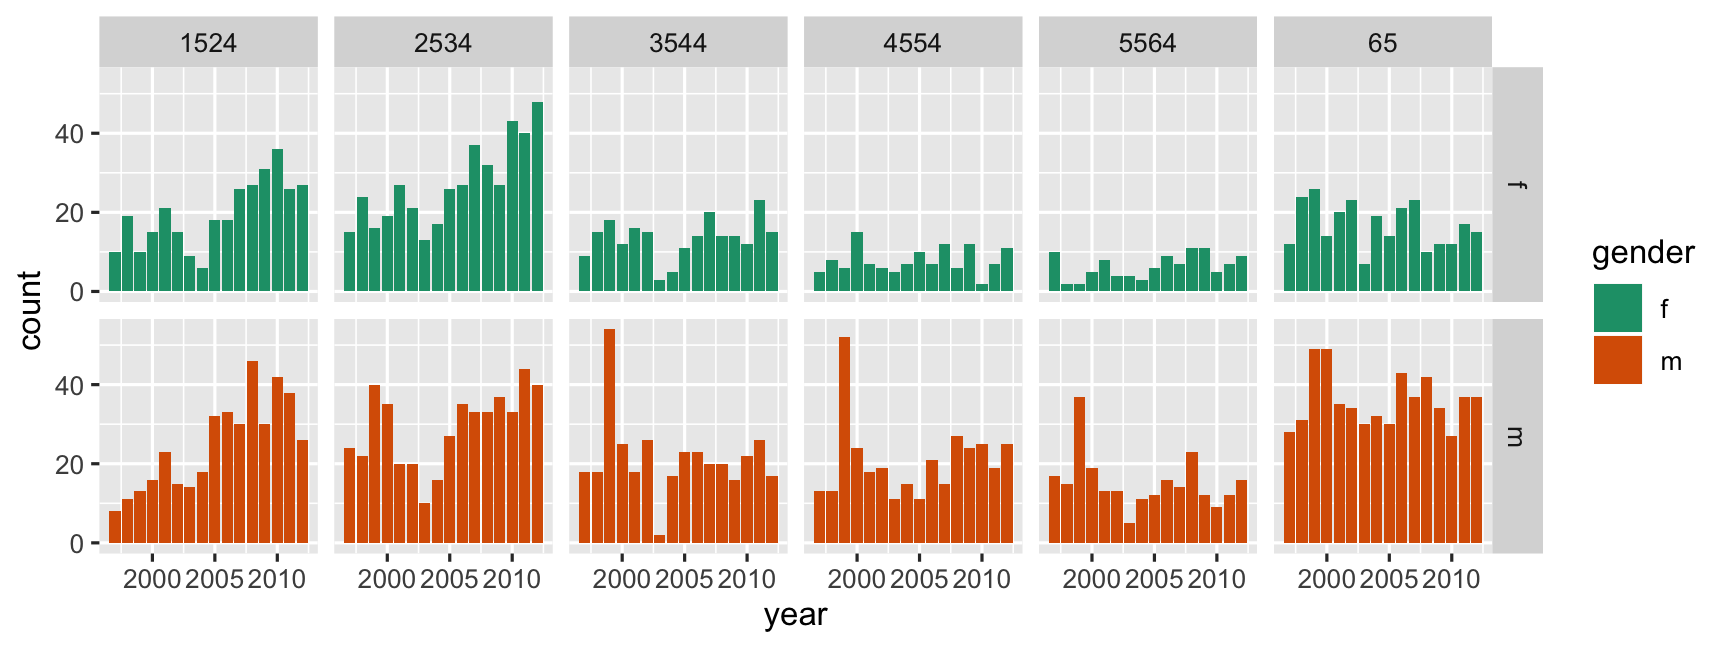
What do we learn?
facet_grid(gender ~ age) +faceted by gender as well as age- note
facet_gridvsfacet_wrap - Easier to focus separately on males and females.
- 1999 outbreak mostly affected males.
- Growing incidence in the 25-34 age group is still affecting females but seems to be have stablised for males.
Pie charts? Rose Charts
ggplot(tb_au, aes(x = year, y = count, fill = gender)) + geom_col() + scale_fill_brewer(palette="Dark2") + facet_grid(gender ~ age) + coord_polar() + theme(axis.text = element_blank())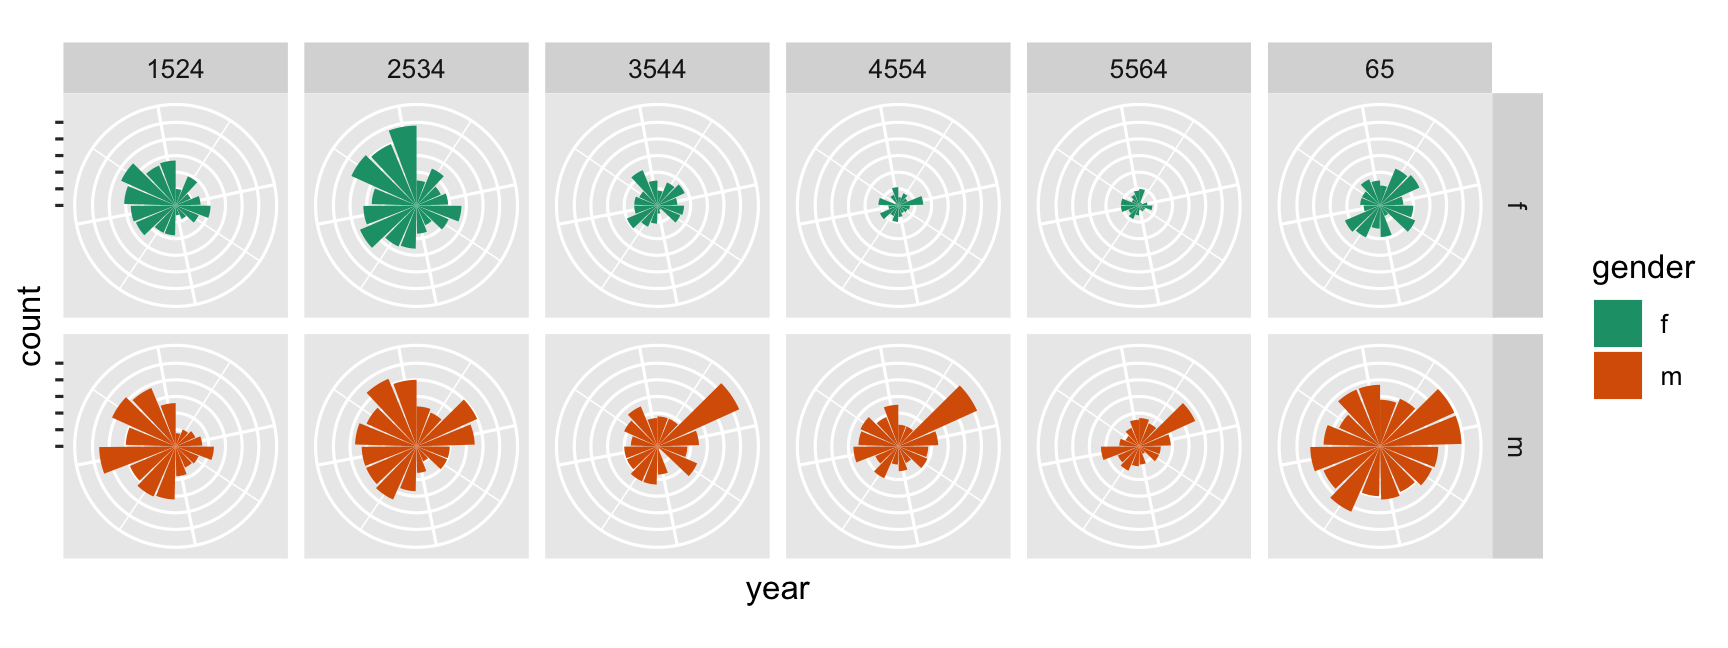
What do we learn?
- Bar charts in polar coordinates produce rose charts.
coord_polar() +plot is made in polar coordinates, rather than the default Cartesian coordinates- Emphasizes the middle years as low incidence.
Rainbow charts?
ggplot(tb_au, aes(x = 1, y = count, fill = factor(year))) + geom_col(position = "fill") + facet_grid(gender ~ age)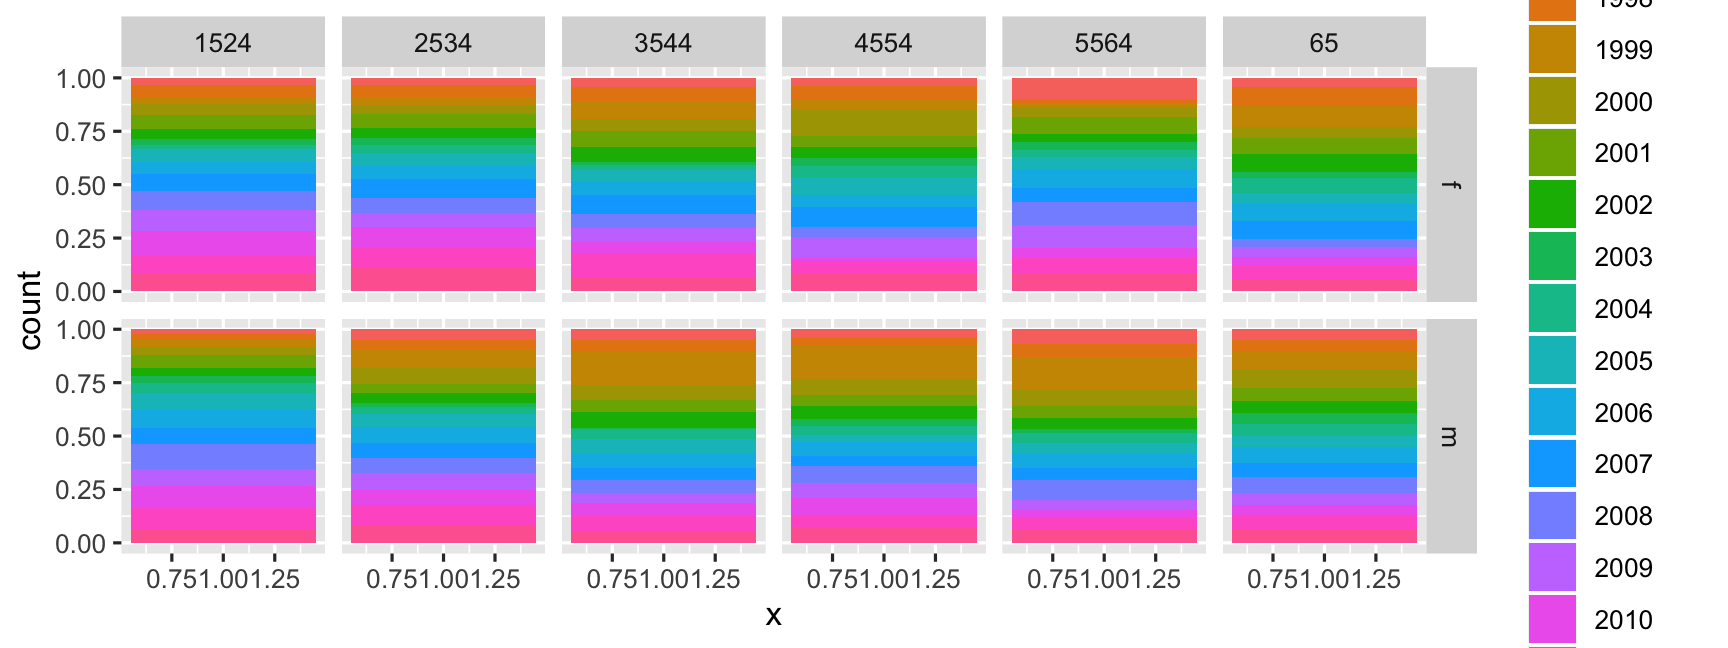
What do we see in the code??
- A single stacked bar, in each facet.
- Year is mapped to colour.
- Notice how the mappings are different. A single number is mapped to x, that makes a single stacked bar chart.
- year is now mapped to colour (that's what gives us the rainbow charts!)
What do we learn?
- Pretty chart but not easy to interpret.
(Actual) Pie charts
ggplot(tb_au, aes(x = 1, y = count, fill = factor(year))) + geom_col(position = "fill") + facet_grid(gender ~ age) + coord_polar(theta = "y") + theme(axis.text = element_blank())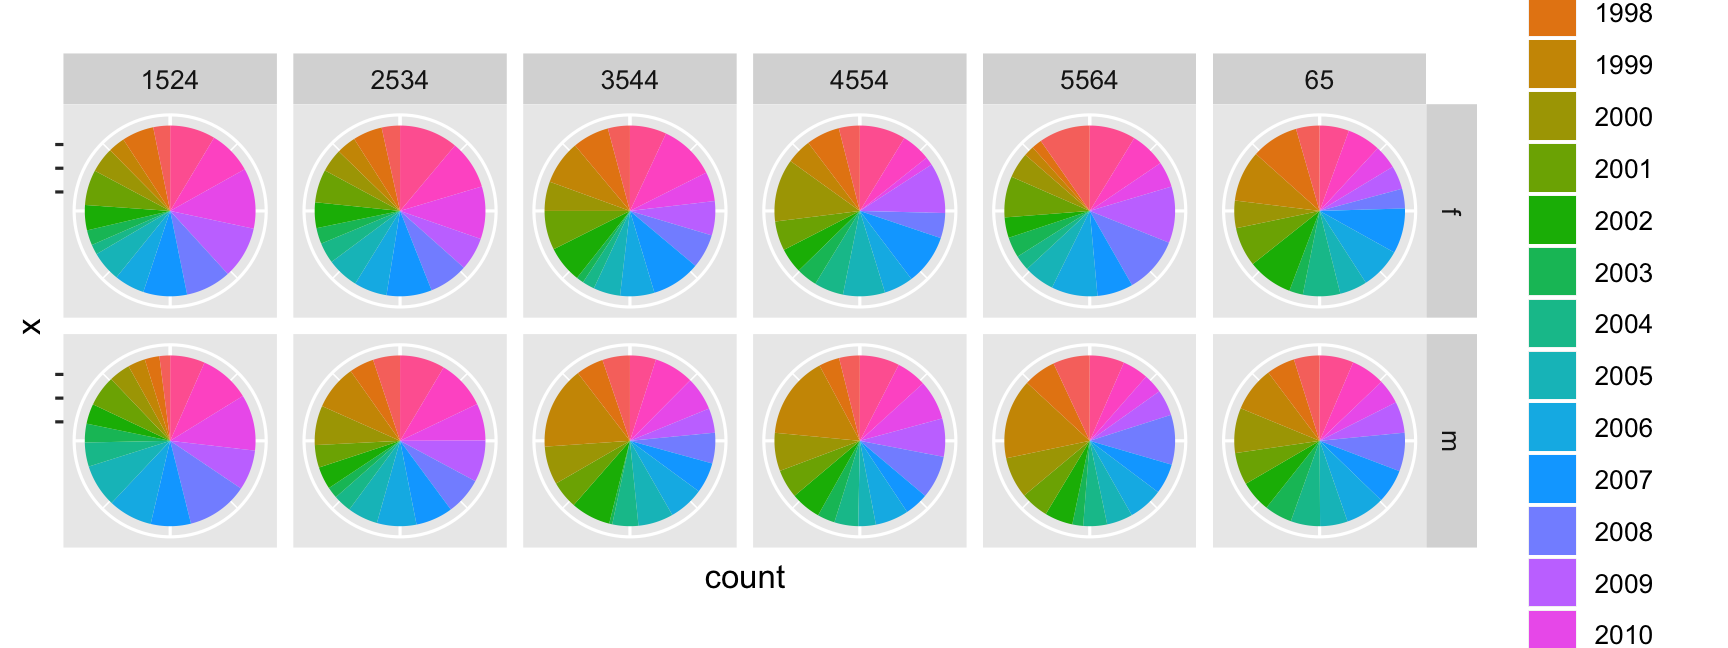
What is different in the code?
coord_polar(theta="y")is using the y variable to do the angles for the polar coordinates to give a pie chart.
What do we learn?
- Pretty chart but not easy to interpret, or make comparisons across age groups.
Why?
The various looks of David Bowie
- Using named plots, eg pie chart, bar chart, scatterplot, is like seeing animals in the zoo.
- The grammar of graphics allows you to define the mapping between variables in the data, with elements of the plot.
- It allows us to see and understand how plots are similar or different.
- And you can see how variations in the definition create variations in the plot.

Your Turn:
- Do the lab exercises
- Take the lab quiz
- Use the rest of the lab time to coordinate with your group on the first assignment.
Share and share alike

This work is licensed under a Creative Commons Attribution-NonCommercial-ShareAlike 4.0 International License.
