ETC1010: Data Modelling and Computing
Week of Tidy Data: Lecture 2
Dr. Nicholas Tierney & Professor Di Cook
EBS, Monash U.
2019-08-09
What is this song?
(you can use your phone!)
recap: from ED survey
- Traffic Light System: Green = "good!" ; Red = "Help!"
- R + Rstudio
- Tower of babel analogy for writing R code
- We are using , not for ETC1010?
- Functions are _
- columns in data frames are accessed with _ ?
- packages are installed with _ ?
- packages are loaded with _ ?
- Why do we care about Reproducibility?
- Output + input of rmarkdown
- I have an assignment group
- If I have an assignment group, have recorded my assignment group in the ED survey
Source: Artwork by @allison_horst
Overview
filter()select()mutate()arrange()
group_by()summarise()count()
Artwork by @allison_horst
R Packages
avail_pkg <- available.packages()dim(avail_pkg)## [1] 14738 17As of 2019-08-09 there are 14738 R packages available
Name clashes
library(tidyverse)## ── Attaching packages ────────────────────────────────────────────── tidyverse 1.2.1 ──## ✔ ggplot2 3.2.0 ✔ purrr 0.3.2## ✔ tibble 2.1.3 ✔ dplyr 0.8.3## ✔ tidyr 0.8.3 ✔ stringr 1.4.0## ✔ readr 1.3.1 ✔ forcats 0.4.0## ── Conflicts ───────────────────────────────────────────────── tidyverse_conflicts() ──## ✖ dplyr::filter() masks stats::filter()## ✖ dplyr::lag() masks stats::lag()Many R packages
- A blessing & a curse!
- So many packages available, it can make it hard to choose!
- Many of the packages are designed to solve a specific problem
- The tidyverse is designed to work with many other packages following a consistent philosophy
- What this means is that you shouldn't notice it!
The best techniques are available, but there can be conflicts between function names. When you load tidyverse it prints a great summary of conflicts that it knows about, between its functions and others.
For example, there is a filter function in the stats package that comes with the R distribution. This can cause confusion when you want to use the filter function in dplyr (part of tidyverse). To be sure the function you use is the one you want to use, you can prefix it with the package name, dplyr::filter().
Let's talk about data
This was an actual experiment in Food Sciences at Iowa State University. The goal was to find out if some cheaper oil options could be used to make hot chips: that people would not be able to distinguish the difference between chips fried in the new oils relative to those fried in the current market leader.
Twelve tasters were recruited to sample two chips from each batch, over a period of ten weeks. The same oil was kept for a period of 10 weeks! May be a bit gross by the end!
This data set was brought to R by Hadley Wickham, and was one of the problems that inspired the thinking about tidy data and the plyr tools.
Example: french fries
- Experiment in Food Sciences at Iowa State University.
- Aim: find if cheaper oil could be used to make hot chips
- Question: Can people distinguish between chips fried in the new oils relative to those current market leader oil.
- 12 tasters recruited
- Each sampled two chips from each batch
- Over a period of ten weeks.
Same oil kept for a period of 10 weeks! May be a bit gross!
Example: french-fries - gathering into long form
french_fries <- read_csv("data/french_fries.csv")french_fries## # A tibble: 6 x 9## time treatment subject rep potato buttery grassy rancid painty## <dbl> <dbl> <dbl> <dbl> <dbl> <dbl> <dbl> <dbl> <dbl>## 1 1 1 3 1 2.9 0 0 0 5.5## 2 1 1 3 2 14 0 0 1.1 0 ## 3 1 1 10 1 11 6.4 0 0 0 ## 4 1 1 10 2 9.9 5.9 2.9 2.2 0 ## 5 1 1 15 1 1.2 0.1 0 1.1 5.1## 6 1 1 15 2 8.8 3 3.6 1.5 2.3Example: french-fries - gathering into long form
french_fries <- read_csv("data/french_fries.csv")french_fries## # A tibble: 6 x 9## time treatment subject rep potato buttery grassy rancid painty## <dbl> <dbl> <dbl> <dbl> <dbl> <dbl> <dbl> <dbl> <dbl>## 1 1 1 3 1 2.9 0 0 0 5.5## 2 1 1 3 2 14 0 0 1.1 0 ## 3 1 1 10 1 11 6.4 0 0 0 ## 4 1 1 10 2 9.9 5.9 2.9 2.2 0 ## 5 1 1 15 1 1.2 0.1 0 1.1 5.1## 6 1 1 15 2 8.8 3 3.6 1.5 2.3This data set was brought to R by Hadley Wickham, and was one of the problems that inspired the thinking about tidy data and the plyr tools.
French fries - gathering into long form
fries_long <- french_fries %>% gather(key = type, value = rating, -time, -treatment, -subject, -rep)French fries - gathering into long form
fries_long <- french_fries %>% gather(key = type, value = rating, -time, -treatment, -subject, -rep)fries_long## # A tibble: 3,480 x 6## time treatment subject rep type rating## <dbl> <dbl> <dbl> <dbl> <fct> <dbl>## 1 1 1 3 1 potato 2.9## 2 1 1 3 2 potato 14 ## 3 1 1 10 1 potato 11 ## 4 1 1 10 2 potato 9.9## 5 1 1 15 1 potato 1.2## 6 1 1 15 2 potato 8.8## 7 1 1 16 1 potato 9 ## 8 1 1 16 2 potato 8.2## 9 1 1 19 1 potato 7 ## 10 1 1 19 2 potato 13 ## # … with 3,470 more rowsfilter(): choose observations from your data
filter(): example
fries_long %>% filter(subject == 10)## # A tibble: 300 x 6## time treatment subject rep type rating## <dbl> <dbl> <dbl> <dbl> <fct> <dbl>## 1 1 1 10 1 potato 11 ## 2 1 1 10 2 potato 9.9## 3 1 2 10 1 potato 9.3## 4 1 2 10 2 potato 11 ## 5 1 3 10 1 potato 11.3## 6 1 3 10 2 potato 10.1## 7 2 1 10 1 potato 8 ## 8 2 1 10 2 potato 10.2## 9 2 2 10 1 potato 11.2## 10 2 2 10 2 potato 8.2## # … with 290 more rowsfilter(): details
Filtering requires comparison to find the subset of observations of interest. What do you think the following mean?
subject != 10x > 10x >= 10class %in% c("A", "B")!is.na(y)
countdown(minutes = 3, play_sound = TRUE)03:00
filter(): details
subject != 10
filter(): details
subject != 10
Find rows corresponding to all subjects except subject 10
filter(): details
x > 10
filter(): details
x > 10
find all rows where variable x has values bigger than 10
filter(): details
x >= 10
filter(): details
x >= 10
finds all rows variable x is greater than or equal to 10.
filter(): details
class %in% c("A", "B")
filter(): details
class %in% c("A", "B")
finds all rows where variable class is either A or B
filter(): details
!is.na(y)
filter(): details
!is.na(y)
finds all rows that DO NOT have a missing value for variable y
Your turn: open french-fries.Rmd
Filter the french fries data to have:
- only week 1
- oil type 1 (oil type is called treatment)
- oil types 1 and 3 but not 2
- weeks 1-4 only
French Fries Filter: only week 1
fries_long %>% filter(time == 1)## # A tibble: 360 x 6## time treatment subject rep type rating## <dbl> <dbl> <dbl> <dbl> <fct> <dbl>## 1 1 1 3 1 potato 2.9## 2 1 1 3 2 potato 14 ## 3 1 1 10 1 potato 11 ## 4 1 1 10 2 potato 9.9## 5 1 1 15 1 potato 1.2## 6 1 1 15 2 potato 8.8## 7 1 1 16 1 potato 9 ## 8 1 1 16 2 potato 8.2## 9 1 1 19 1 potato 7 ## 10 1 1 19 2 potato 13 ## # … with 350 more rowsFrench Fries Filter: oil type 1
fries_long %>% filter(treatment == 1)## # A tibble: 1,160 x 6## time treatment subject rep type rating## <dbl> <dbl> <dbl> <dbl> <fct> <dbl>## 1 1 1 3 1 potato 2.9## 2 1 1 3 2 potato 14 ## 3 1 1 10 1 potato 11 ## 4 1 1 10 2 potato 9.9## 5 1 1 15 1 potato 1.2## 6 1 1 15 2 potato 8.8## 7 1 1 16 1 potato 9 ## 8 1 1 16 2 potato 8.2## 9 1 1 19 1 potato 7 ## 10 1 1 19 2 potato 13 ## # … with 1,150 more rowsFrench Fries Filter: oil types 1 and 3 but not 2
fries_long %>% filter(treatment != 2)## # A tibble: 2,320 x 6## time treatment subject rep type rating## <dbl> <dbl> <dbl> <dbl> <fct> <dbl>## 1 1 1 3 1 potato 2.9## 2 1 1 3 2 potato 14 ## 3 1 1 10 1 potato 11 ## 4 1 1 10 2 potato 9.9## 5 1 1 15 1 potato 1.2## 6 1 1 15 2 potato 8.8## 7 1 1 16 1 potato 9 ## 8 1 1 16 2 potato 8.2## 9 1 1 19 1 potato 7 ## 10 1 1 19 2 potato 13 ## # … with 2,310 more rowsFrench Fries Filter: weeks 1-4 only
fries_long %>% filter(time %in% c("1", "2", "3", "4"))## # A tibble: 1,440 x 6## time treatment subject rep type rating## <dbl> <dbl> <dbl> <dbl> <fct> <dbl>## 1 1 1 3 1 potato 2.9## 2 1 1 3 2 potato 14 ## 3 1 1 10 1 potato 11 ## 4 1 1 10 2 potato 9.9## 5 1 1 15 1 potato 1.2## 6 1 1 15 2 potato 8.8## 7 1 1 16 1 potato 9 ## 8 1 1 16 2 potato 8.2## 9 1 1 19 1 potato 7 ## 10 1 1 19 2 potato 13 ## # … with 1,430 more rowsabout %in%
[demo]
select()
select()
- Chooses which variables to keep in the data set.
- Useful when there are many variables but you only need some of them for an analysis.
select(): a comma separated list of variables, by name.
french_fries %>% select(time, treatment, subject)## # A tibble: 696 x 3## time treatment subject## <dbl> <dbl> <dbl>## 1 1 1 3## 2 1 1 3## 3 1 1 10## 4 1 1 10## 5 1 1 15## 6 1 1 15## 7 1 1 16## 8 1 1 16## 9 1 1 19## 10 1 1 19## # … with 686 more rowsselect(): drop selected variables by prefixing with -
select(): drop selected variables by prefixing with -
french_fries %>% select(-time, -treatment, -subject)## # A tibble: 696 x 6## rep potato buttery grassy rancid painty## <dbl> <dbl> <dbl> <dbl> <dbl> <dbl>## 1 1 2.9 0 0 0 5.5## 2 2 14 0 0 1.1 0 ## 3 1 11 6.4 0 0 0 ## 4 2 9.9 5.9 2.9 2.2 0 ## 5 1 1.2 0.1 0 1.1 5.1## 6 2 8.8 3 3.6 1.5 2.3## 7 1 9 2.6 0.4 0.1 0.2## 8 2 8.2 4.4 0.3 1.4 4 ## 9 1 7 3.2 0 4.9 3.2## 10 2 13 0 3.1 4.3 10.3## # … with 686 more rowsselect(): Using it
Inside select() you can use text-matching of the names like starts_with(), ends_with(), contains(), matches(), or everything()
select(): Using it
Inside select() you can use text-matching of the names like starts_with(), ends_with(), contains(), matches(), or everything()
french_fries %>% select(contains("e"))## # A tibble: 696 x 5## time treatment subject rep buttery## <dbl> <dbl> <dbl> <dbl> <dbl>## 1 1 1 3 1 0 ## 2 1 1 3 2 0 ## 3 1 1 10 1 6.4## 4 1 1 10 2 5.9## 5 1 1 15 1 0.1## 6 1 1 15 2 3 ## 7 1 1 16 1 2.6## 8 1 1 16 2 4.4## 9 1 1 19 1 3.2## 10 1 1 19 2 0 ## # … with 686 more rowsselect(): Using it
You can use : to choose variables in order of the columns
select(): Using it
You can use : to choose variables in order of the columns
french_fries %>% select(time:subject)## # A tibble: 696 x 3## time treatment subject## <dbl> <dbl> <dbl>## 1 1 1 3## 2 1 1 3## 3 1 1 10## 4 1 1 10## 5 1 1 15## 6 1 1 15## 7 1 1 16## 8 1 1 16## 9 1 1 19## 10 1 1 19## # … with 686 more rowsYour turn: back to the french fries data
select()time, treatment and repselect()subject through to rating- drop subject
03:00
Artwork by @allison_horst
mutate(): create a new variable; keep existing ones
french_fries## # A tibble: 696 x 9## time treatment subject rep potato buttery grassy rancid painty## <dbl> <dbl> <dbl> <dbl> <dbl> <dbl> <dbl> <dbl> <dbl>## 1 1 1 3 1 2.9 0 0 0 5.5## 2 1 1 3 2 14 0 0 1.1 0 ## 3 1 1 10 1 11 6.4 0 0 0 ## 4 1 1 10 2 9.9 5.9 2.9 2.2 0 ## 5 1 1 15 1 1.2 0.1 0 1.1 5.1## 6 1 1 15 2 8.8 3 3.6 1.5 2.3## 7 1 1 16 1 9 2.6 0.4 0.1 0.2## 8 1 1 16 2 8.2 4.4 0.3 1.4 4 ## 9 1 1 19 1 7 3.2 0 4.9 3.2## 10 1 1 19 2 13 0 3.1 4.3 10.3## # … with 686 more rowsmutate(): create a new variable; keep existing ones
french_fries %>% mutate(rainty = rancid + painty)## # A tibble: 696 x 10## time treatment subject rep potato buttery grassy rancid painty rainty## <dbl> <dbl> <dbl> <dbl> <dbl> <dbl> <dbl> <dbl> <dbl> <dbl>## 1 1 1 3 1 2.9 0 0 0 5.5 5.5 ## 2 1 1 3 2 14 0 0 1.1 0 1.1 ## 3 1 1 10 1 11 6.4 0 0 0 0 ## 4 1 1 10 2 9.9 5.9 2.9 2.2 0 2.2 ## 5 1 1 15 1 1.2 0.1 0 1.1 5.1 6.20## 6 1 1 15 2 8.8 3 3.6 1.5 2.3 3.8 ## 7 1 1 16 1 9 2.6 0.4 0.1 0.2 0.3 ## 8 1 1 16 2 8.2 4.4 0.3 1.4 4 5.4 ## 9 1 1 19 1 7 3.2 0 4.9 3.2 8.1 ## 10 1 1 19 2 13 0 3.1 4.3 10.3 14.6 ## # … with 686 more rowsYour turn: french fries
Compute a new variable called lrating by taking a log of the rating
02:00
summarise(): boil data down to one row observation
fries_long## # A tibble: 6 x 6## time treatment subject rep type rating## <dbl> <dbl> <dbl> <dbl> <fct> <dbl>## 1 1 1 3 1 potato 2.9## 2 1 1 3 2 potato 14 ## 3 1 1 10 1 potato 11 ## 4 1 1 10 2 potato 9.9## 5 1 1 15 1 potato 1.2## 6 1 1 15 2 potato 8.8summarise(): boil data down to one row observation
fries_long## # A tibble: 6 x 6## time treatment subject rep type rating## <dbl> <dbl> <dbl> <dbl> <fct> <dbl>## 1 1 1 3 1 potato 2.9## 2 1 1 3 2 potato 14 ## 3 1 1 10 1 potato 11 ## 4 1 1 10 2 potato 9.9## 5 1 1 15 1 potato 1.2## 6 1 1 15 2 potato 8.8fries_long %>% summarise(rating = mean(rating, na.rm = TRUE))## # A tibble: 1 x 1## rating## <dbl>## 1 3.16But what if we want to get a summary for each type?
But what if we want to get a summary for each type?
use group_by()
Using summarise() + group_by()
Produce summaries for every group:
fries_long %>% group_by(type) %>% summarise(rating = mean(rating, na.rm=TRUE))## # A tibble: 5 x 2## type rating## <fct> <dbl>## 1 buttery 1.82 ## 2 grassy 0.664## 3 painty 2.52 ## 4 potato 6.95 ## 5 rancid 3.85Your turn: Back to french-fries.Rmd
- Compute the average rating by subject
- Compute the average rancid rating per week
03:00
french fries answers
fries_long %>% group_by(subject) %>% summarise(rating = mean(rating, na.rm=TRUE))## # A tibble: 12 x 2## subject rating## <dbl> <dbl>## 1 3 2.46## 2 10 4.24## 3 15 2.16## 4 16 3.00## 5 19 4.54## 6 31 4.00## 7 51 4.39## 8 52 2.72## 9 63 3.48## 10 78 1.94## 11 79 1.94## 12 86 2.94french fries answers
fries_long %>% filter(type == "rancid") %>% group_by(time) %>% summarise(rating = mean(rating, na.rm=TRUE))## # A tibble: 10 x 2## time rating## <dbl> <dbl>## 1 1 2.36## 2 2 2.85## 3 3 3.72## 4 4 3.60## 5 5 3.53## 6 6 4.08## 7 7 3.89## 8 8 4.27## 9 9 4.67## 10 10 6.07arrange(): orders data by a given variable.
arrange(): orders data by a given variable.
Useful for display of results (but there are other uses!)
fries_long %>% group_by(type) %>% summarise(rating = mean(rating, na.rm=TRUE))## # A tibble: 5 x 2## type rating## <fct> <dbl>## 1 buttery 1.82 ## 2 grassy 0.664## 3 painty 2.52 ## 4 potato 6.95 ## 5 rancid 3.85arrange()
fries_long %>% group_by(type) %>% summarise(rating = mean(rating, na.rm=TRUE)) %>% arrange(rating)## # A tibble: 5 x 2## type rating## <fct> <dbl>## 1 grassy 0.664## 2 buttery 1.82 ## 3 painty 2.52 ## 4 rancid 3.85 ## 5 potato 6.95Your turn: french-fries.Rmd - arrange
- Arrange the average rating by type in decreasing order
- Arrange the average subject rating in order lowest to highest.
02:00
arrange() answers
fries_long %>% group_by(type) %>% summarise(rating = mean(rating, na.rm=TRUE)) %>% arrange(desc(rating))## # A tibble: 5 x 2## type rating## <fct> <dbl>## 1 potato 6.95 ## 2 rancid 3.85 ## 3 painty 2.52 ## 4 buttery 1.82 ## 5 grassy 0.664arrange() answers
fries_long %>% group_by(subject) %>% summarise(rating = mean(rating, na.rm=TRUE)) %>% arrange(rating)## # A tibble: 12 x 2## subject rating## <dbl> <dbl>## 1 78 1.94## 2 79 1.94## 3 15 2.16## 4 3 2.46## 5 52 2.72## 6 86 2.94## 7 16 3.00## 8 63 3.48## 9 31 4.00## 10 10 4.24## 11 51 4.39## 12 19 4.54count() the number of things in a given column
fries_long %>% count(type, sort = TRUE)## # A tibble: 5 x 2## type n## <fct> <int>## 1 buttery 696## 2 grassy 696## 3 painty 696## 4 potato 696## 5 rancid 696Your turn: count()
- count the number of subjects
- count the number of types
02:00
French Fries: Putting it together to problem solve
French Fries: Are ratings similar?
fries_long %>% group_by(type) %>% summarise(m = mean(rating, na.rm = TRUE), sd = sd(rating, na.rm = TRUE)) %>% arrange(-m)## # A tibble: 5 x 3## type m sd## <fct> <dbl> <dbl>## 1 potato 6.95 3.58## 2 rancid 3.85 3.78## 3 painty 2.52 3.39## 4 buttery 1.82 2.41## 5 grassy 0.664 1.32French Fries: Are ratings similar?
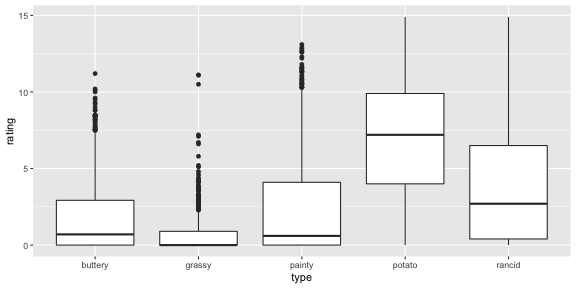
fries_long %>% group_by(type) %>% summarise(m = mean(rating, na.rm = TRUE), sd = sd(rating, na.rm = TRUE)) %>% arrange(-m)## # A tibble: 5 x 3## type m sd## <fct> <dbl> <dbl>## 1 potato 6.95 3.58## 2 rancid 3.85 3.78## 3 painty 2.52 3.39## 4 buttery 1.82 2.41## 5 grassy 0.664 1.32The scales of the ratings are quite different. Mostly the chips are rated highly on potato'y, but low on grassy.
French Fries: Are ratings similar?
ggplot(fries_long, aes(x = type, y = rating)) + geom_boxplot()
French Fries: Are reps like each other?
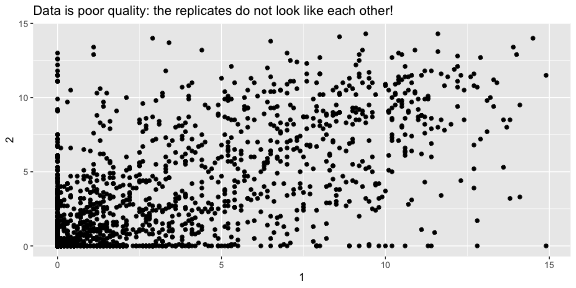
fries_spread <- fries_long %>% spread(key = rep, value = rating)fries_spread## # A tibble: 1,740 x 6## time treatment subject type `1` `2`## <dbl> <dbl> <dbl> <fct> <dbl> <dbl>## 1 1 1 3 buttery 0 0 ## 2 1 1 3 grassy 0 0 ## 3 1 1 3 painty 5.5 0 ## 4 1 1 3 potato 2.9 14 ## 5 1 1 3 rancid 0 1.1## 6 1 1 10 buttery 6.4 5.9## 7 1 1 10 grassy 0 2.9## 8 1 1 10 painty 0 0 ## 9 1 1 10 potato 11 9.9## 10 1 1 10 rancid 0 2.2## # … with 1,730 more rowsFrench Fries: Are reps like each other?
summarise(fries_spread, r = cor(`1`, `2`, use = "complete.obs"))## # A tibble: 1 x 1## r## <dbl>## 1 0.668 ggplot(fries_spread, aes(x = `1`, y = `2`)) + geom_point() + labs(title = "Data is poor quality: the replicates do not look like each other!")

French Fries: Replicates by rating type
fries_spread %>% group_by(type) %>% summarise(r = cor(x = `1`, y = `2`, use = "complete.obs"))## # A tibble: 5 x 2## type r## <fct> <dbl>## 1 buttery 0.650## 2 grassy 0.239## 3 painty 0.479## 4 potato 0.616## 5 rancid 0.391French Fries: Replicates by rating type
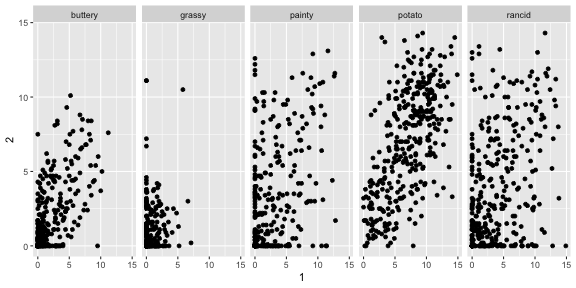
ggplot(fries_spread, aes(x=`1`, y=`2`)) + geom_point() + facet_wrap(~type, ncol = 5)
French Fries: Replicates by rating type
ggplot(fries_spread, aes(x=`1`, y=`2`)) + geom_point() + facet_wrap(~type, ncol = 5)
Potato'y and buttery have better replication than the other scales, but there is still a lot of variation from rep 1 to 2.
Lab exercise: Exploring data PISA data
Open pisa.Rmd on rstudio cloud.
Lab Quiz
Time to take the lab quiz.
Share and share alike

This work is licensed under a Creative Commons Attribution-NonCommercial-ShareAlike 4.0 International License.
select() example
tb <- read_csv("data/TB_notifications_2018-03-18.csv") %>% select(country, year, starts_with("new_sp_")) tb %>% top_n(20)## # A tibble: 22 x 22## country year new_sp_m04 new_sp_m514 new_sp_m014 new_sp_m1524## <chr> <dbl> <dbl> <dbl> <dbl> <dbl>## 1 Argent… 2008 11 58 69 633## 2 Argent… 2009 8 36 44 546## 3 Argent… 2011 50 93 143 664## 4 Argent… 2012 8 51 59 533## 5 Brazil 2010 130 168 298 4405## 6 Brazil 2012 112 165 277 5027## 7 Centra… 2010 23 55 78 379## 8 Centra… 2011 14 56 70 362## 9 Guinea… 2012 1 6 7 145## 10 Italy 2005 7 1 8 93## # … with 12 more rows, and 16 more variables: new_sp_m2534 <dbl>,## # new_sp_m3544 <dbl>, new_sp_m4554 <dbl>, new_sp_m5564 <dbl>,## # new_sp_m65 <dbl>, new_sp_mu <dbl>, new_sp_f04 <dbl>,## # new_sp_f514 <dbl>, new_sp_f014 <dbl>, new_sp_f1524 <dbl>,## # new_sp_f2534 <dbl>, new_sp_f3544 <dbl>, new_sp_f4554 <dbl>,## # new_sp_f5564 <dbl>, new_sp_f65 <dbl>, new_sp_fu <dbl>